
A self-hosted Sentry alternative should help your team investigate a failed request, identify the affected release, and decide what to fix. GlitchTip and Bugsink are useful candidates when you want to keep supported Sentry SDK instrumentation. SigNoz, HyperDX and a Grafana-based stack address a broader need: investigating incidents through multiple types of telemetry.
Start with the debugging work you need to preserve. Then test that workflow on your own application before choosing a VPS size or moving production traffic. SDK compatibility, usable stack traces, retention and recovery matter more than a long feature checklist.
Choose a Shortlist by Debugging Workflow
Write down a recent incident and the evidence that would have shortened it. An exception with its original source location may be enough for a small application. A failure spanning a queue, API and database may require traces and logs from several services. These are different selection criteria.
| Candidate | Reason to evaluate it | Pilot question |
|---|---|---|
| GlitchTip | Sentry-compatible ingestion with errors, performance monitoring, uptime checks and logs. | Do the specific SDK features and investigation views you use work? |
| Bugsink | An error-tracking workflow using supported Sentry SDKs. | Are issue grouping and readable stack traces enough for your team? |
| Self-hosted Sentry | Continuity with the Sentry product and its self-hosted distribution. | Can you operate the current deployment and verify every required feature? |
| SigNoz | An OpenTelemetry-oriented platform for traces, logs and metrics. | Can engineers follow a real incident across the signals you collect? |
| HyperDX / ClickStack | Searching and correlating telemetry in a ClickHouse-based stack. | Does this investigation workflow justify the stack you must run? |
| Grafana-based stack | Combining separate telemetry backends and visualization tools. | Who will integrate ingestion, dashboards and alerts? |
The scope above follows the current GlitchTip documentation, Bugsink documentation and Sentry self-hosted project. Start with two candidates that match your requirements; testing every product usually adds work without clarifying the decision.
A DSN Change Moves New Events, Not Old History
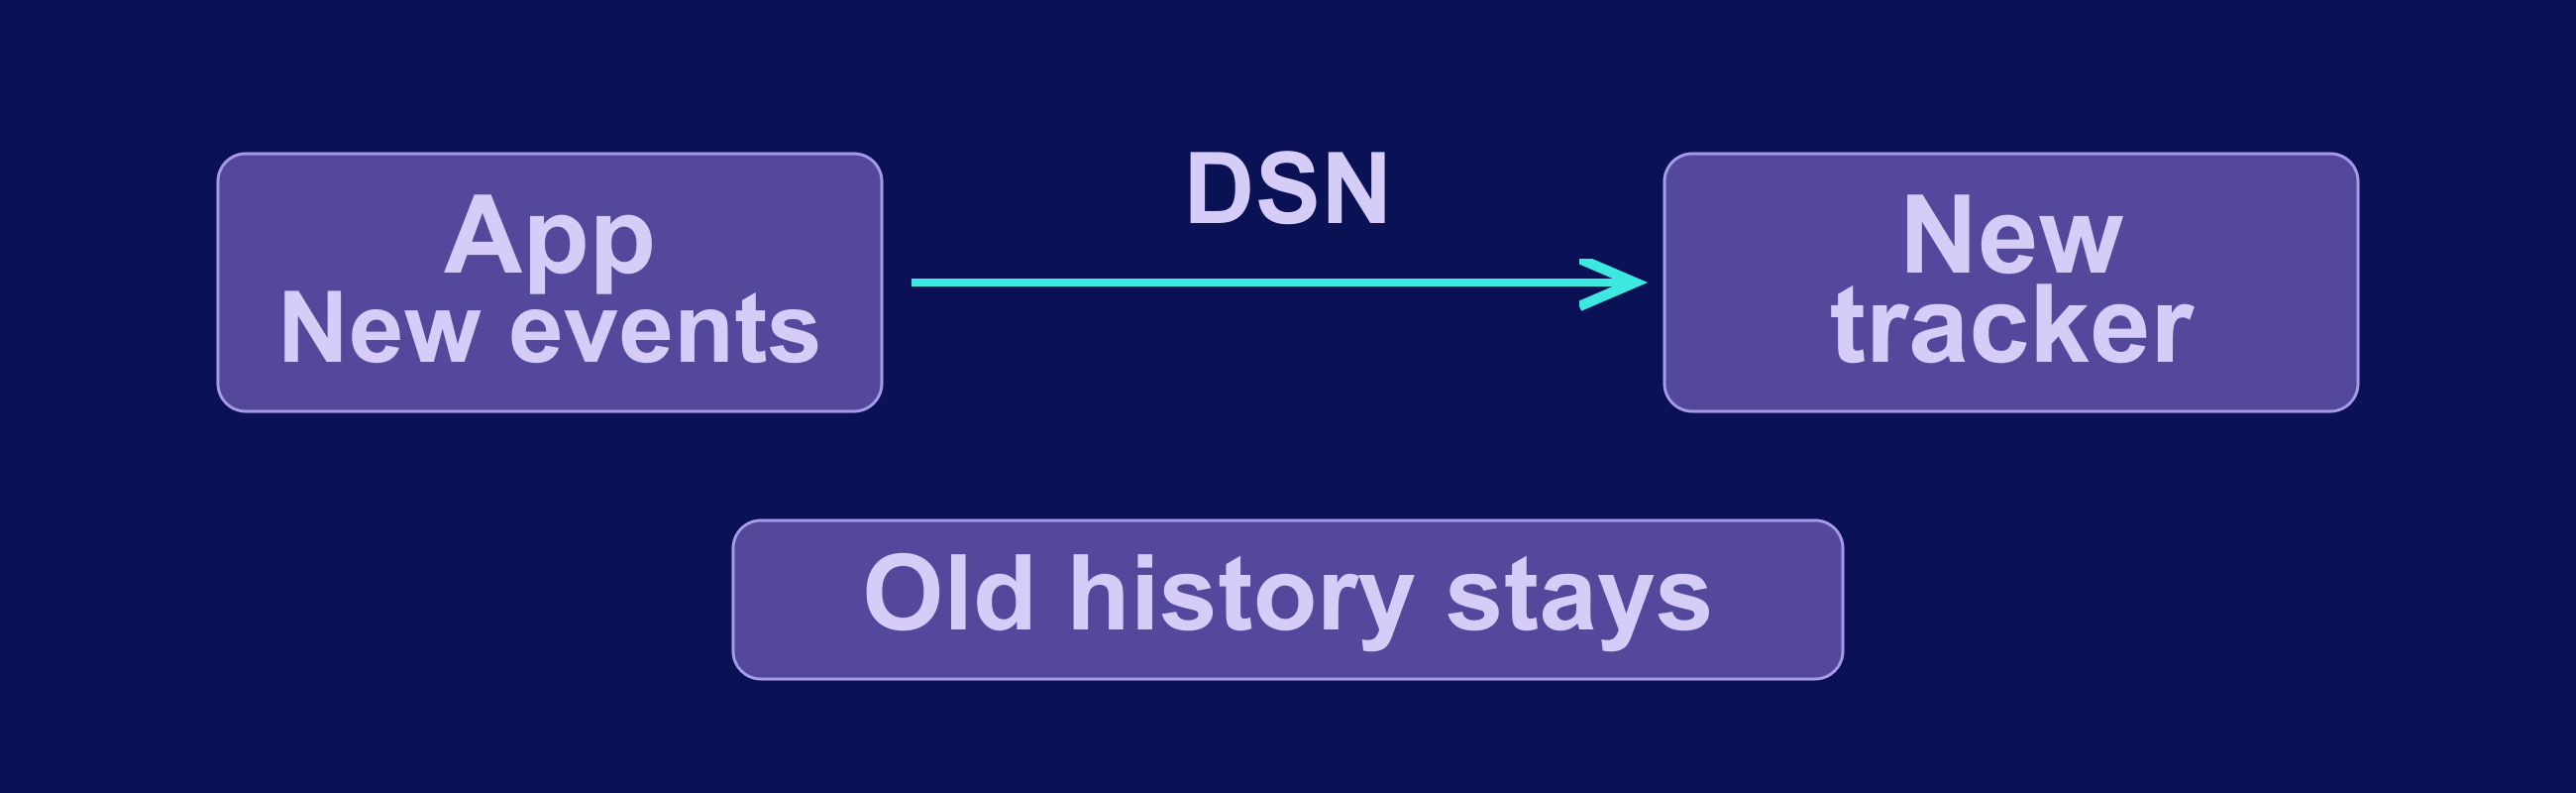
A DSN tells an SDK where to send events. Changing it can redirect new errors to another tracker, but it does not copy historical issues, users, alert rules, attachments or project settings. Treat event ingestion and historical-data access as separate migration tasks.
GlitchTip publishes setup instructions for Sentry SDKs. Bugsink also documents Sentry SDK compatibility. Neither statement means every SDK feature, envelope type or future SDK release will behave identically across products. Record the SDK name and version used by each application, plus the event types it actually sends.
For the pilot, create a separate destination project and route a controlled test deployment to it. Confirm the event arrives with the expected environment and release. Keep the original endpoint configuration available, and decide how engineers will consult old incidents while the previous tracker remains accessible.
Check GlitchTip and Bugsink Against Your Required Features
Do not dismiss GlitchTip as an errors-only tool. Its current logs documentation describes ingestion, storage and querying of logs, including correlation with traces and issues. It also distinguishes logs sent through Sentry SDK envelopes from a raw OTLP receiver. If your applications already export through an OpenTelemetry Collector, verify the supported ingestion path rather than assuming an endpoint can be swapped.
Bugsink is worth piloting when your priority is finding and fixing exceptions. For browser applications, its source-map workflow deserves an early test: a received JavaScript error is useful only if you can trace it back to the code you shipped. Confirm the required build integration with a real release artifact.
Check deployment dependencies separately from feature coverage. GlitchTip’s installation guide describes PostgreSQL and alternative application/worker layouts. Bugsink’s Docker Compose guide includes a database-backed deployment example. Use the current instructions for your chosen release; an old comparison table is not an installation specification.
Self-hosted Sentry belongs on the shortlist when a Sentry-specific workflow is essential. Validate it against the self-hosted distribution, including integrations and operational requirements. Familiarity with the hosted interface is not evidence that every hosted capability is available in your own installation.
Decide Whether You Need an OpenTelemetry Platform

Choose a broader telemetry platform when an issue cannot be understood from the exception alone. For example, you may need to follow a request through several services and inspect the logs around a slow dependency. That benefit depends on consistent instrumentation and useful context, not simply installing another dashboard.
SigNoz brings application performance monitoring, logs and metrics into an OpenTelemetry-oriented product. HyperDX is part of ClickStack, whose documented components include ClickHouse, HyperDX, an OpenTelemetry Collector and MongoDB. The current HyperDX repository is MIT-licensed; evaluate the exact distribution and dependencies you intend to deploy.
A Grafana-based stack combines tools with distinct jobs, such as Loki for logs, Tempo for traces and Mimir for metrics. This can suit a team that already operates those components. It also leaves integration choices—collectors, labels, retention, dashboards and alerts—with your operators.
For each candidate, demonstrate one complete investigation. Start from a failed user action, locate the relevant event or trace, and identify the responsible service or release. If engineers cannot repeat that process without the person who installed the platform, improve instrumentation and documentation before expanding ingestion.
Test Debugging Quality With a Real Release
A successful HTTP response from an ingestion endpoint proves little about the next incident. Send controlled errors from the languages, frameworks and release process you actually use, and collect evidence for each check below.
| Pilot check | Evidence to keep |
|---|---|
| Event capture | The expected backend and browser errors arrive in the correct project and environment. |
| Readable stack traces | A shipped build resolves to the expected source file and line using its matching source maps or debug artifacts. |
| Release association | Engineers can identify which deployed version produced the event. |
| Issue grouping | Repeated instances of the same fault group usefully; a deliberately different fault remains distinguishable. |
| Alerts | A test issue reaches the intended destination, and repeated events do not create an unusable notification stream. |
| Data filtering | Stored test payloads exclude the sensitive fields you deliberately marked for removal. |
| Recovery and upgrades | A restore and a documented upgrade can be completed in an isolated test environment. |
Use a small set of representative failures that your team understands. Record what passed, what failed and the workaround required. Avoid assigning numerical compatibility scores: a single missing feature can matter more than several supported features that nobody uses.
Plan Storage and the Failure Domain
A single VPS can make a pilot straightforward, but the tracker, database and workers then share CPU, memory and disk. If the monitored application also lives there, one host outage can take both the application and its error tracker offline. Decide whether that limitation is acceptable before treating the pilot as production infrastructure.
Size from observations of the complete stack. Track disk growth, ingestion backlog, memory pressure, query responsiveness and backup duration during representative traffic. Include a burst of repeated errors: the period when the application is failing may be the period when the tracker receives the most work.
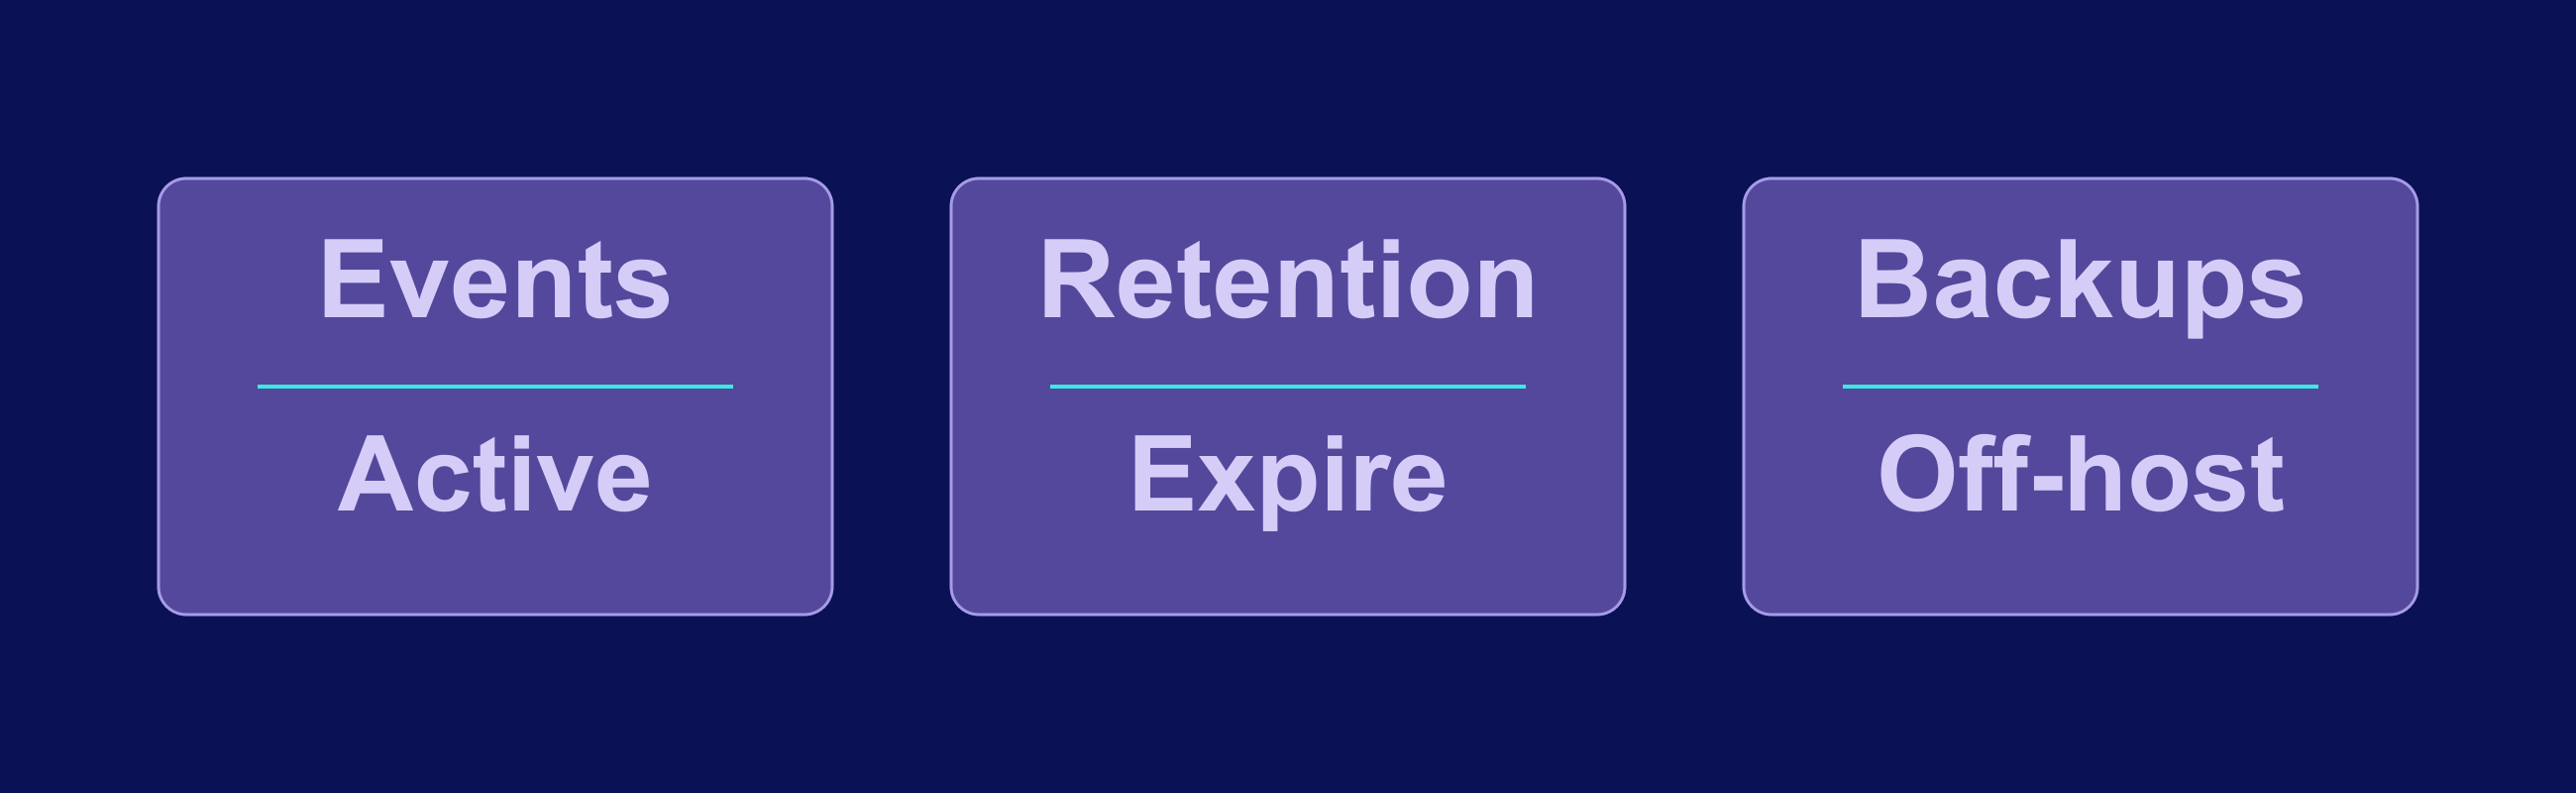
- Active data: measure the space used by events, logs, indexes, source maps and attachments that you actually retain.
- Retention: set an explicit window for each data type and verify that cleanup runs. Longer retention affects backup size and recovery time as well as live storage.
- Recovery: keep a recoverable off-host copy of required data and configuration, then test restoring it to a separate environment.
- Isolation: separate the database or workers when measured contention justifies it, with a clear plan for network access and backups.
Our guides to running Docker on a VPS and self-hosted backups provide background for operating the stack. A product’s minimum memory figure is a starting constraint, not a guarantee that your workload will fit.
Choose a hosting region that fits application latency and your own data-handling requirements. Include backup locations in that decision. Before committing to a KVM VPS plan, confirm that storage growth and recovery needs fit the resources you intend to buy.
Protect Event Data and Assign an Operations Owner
Error payloads can contain request details, user identifiers and application context. Review what the SDK sends before enabling broad collection. Test scrubbing with synthetic values, restrict project access, and keep administrative credentials separate from application ingestion configuration.
Publish only the endpoints that need to be reachable. Keep databases and internal worker interfaces private, configure HTTPS for ingestion and the user interface, and verify access controls from outside the VPS. Set retention deliberately rather than leaving every new signal enabled indefinitely.
Assign an owner for upgrades, disk monitoring, backup failures and restore tests. Also monitor whether the tracker itself is reachable from outside its own host. An operations checklist is useful only when someone responds to it. If nobody can maintain the service, compare a managed option before adding another production dependency.
Migrate Gradually and Keep a Rollback Path
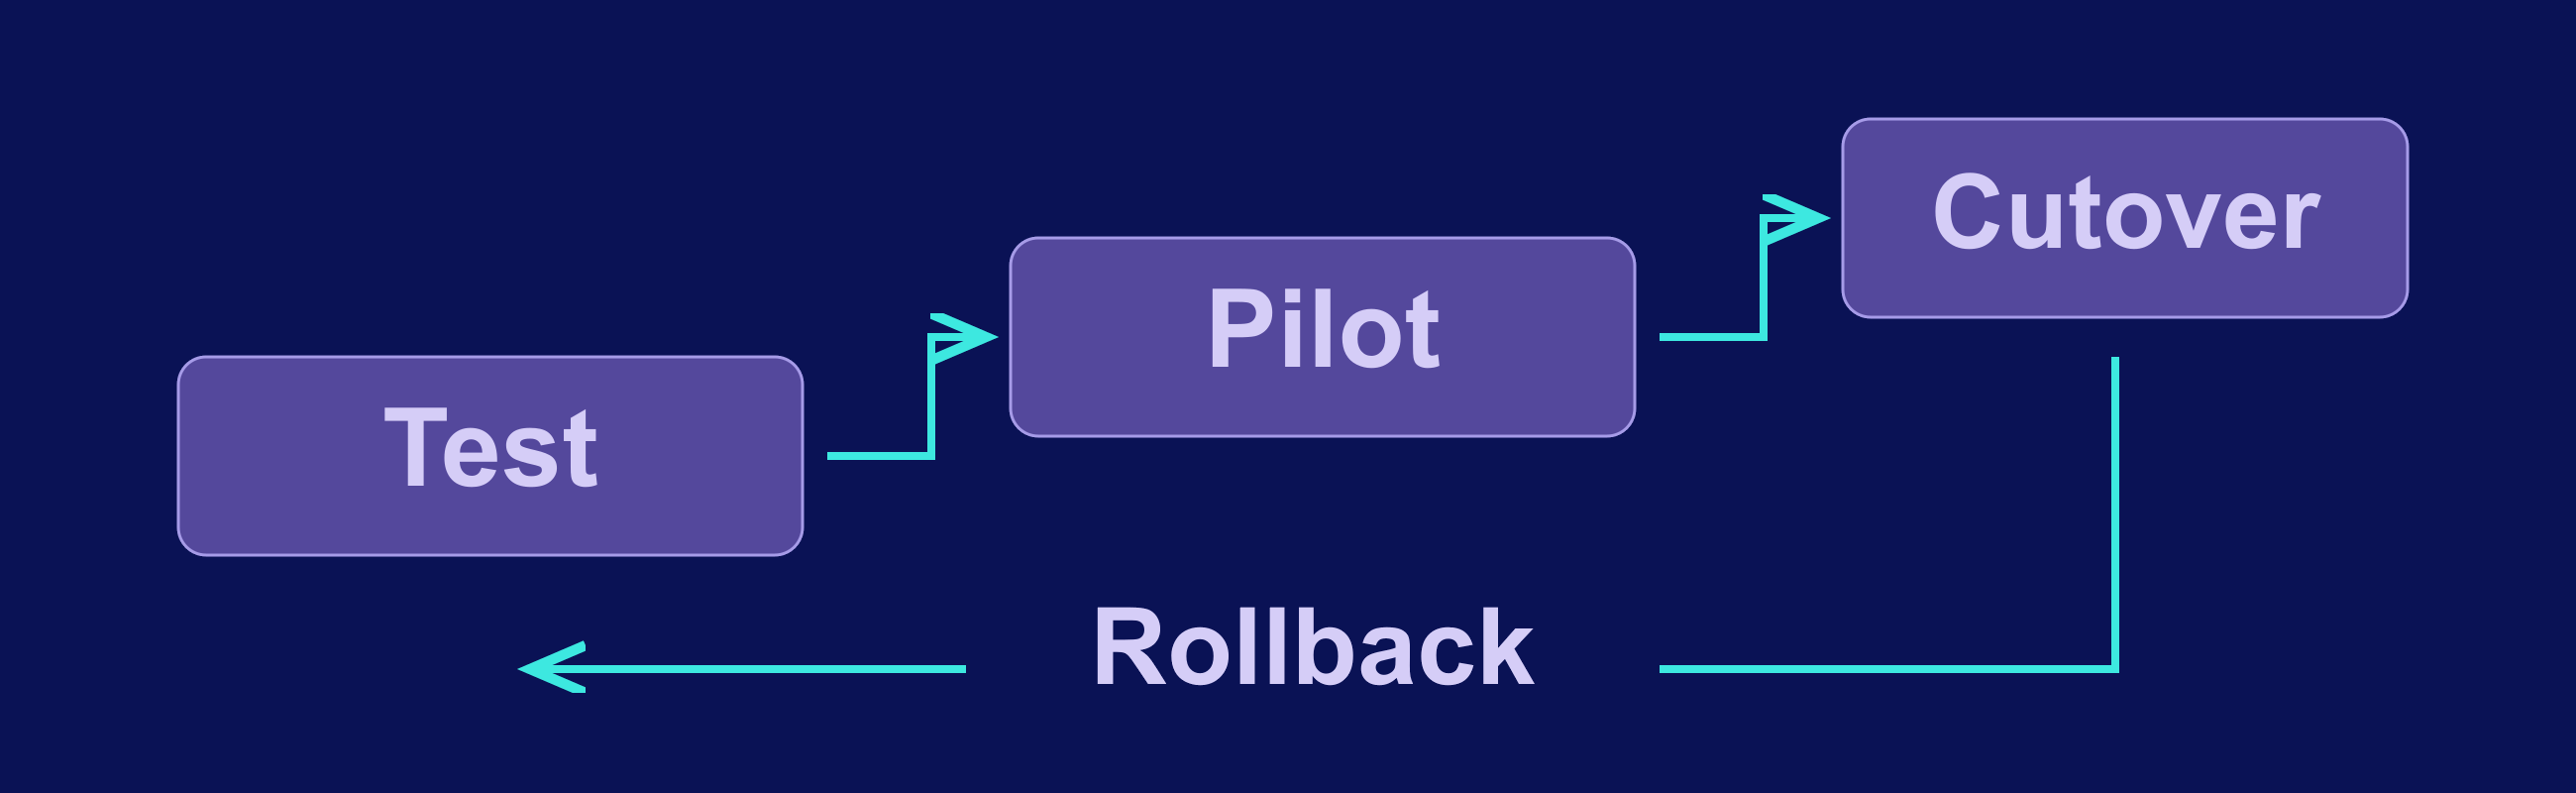
Move through a test project, a limited production pilot and a wider cutover. At each stage, compare the events you expect with what the new system actually stores. Define acceptable delivery delay, debugging quality and resource behavior for your workload before expanding the rollout.
- Test: validate SDK behavior, release artifacts, filtering and alerts with synthetic failures.
- Pilot: move one application or controlled deployment and observe it through a real release cycle.
- Cut over: expand only after the pilot passes, retaining the previous endpoint configuration and access needed for rollback.
- Retire deliberately: decide when historical data and the old service can be removed under your retention and recovery plan.
If you send events to two systems during comparison, make that an intentional, tested arrangement. Check SDK support, duplicate alerts and data exposure. Do not assume dual delivery happens automatically or that reversing a DSN change will backfill events captured elsewhere.
The useful choice is the tracker your developers can debug with and your operators can maintain. Prove that combination with a real release, measured resource behavior and a working restore before making it a permanent part of your infrastructure.
Frequently Asked Questions
What is the best self-hosted Sentry alternative for a small team?
Does GlitchTip support logs?
Will changing the DSN migrate old Sentry issues?
How much RAM does an error-tracking VPS need?
When is SigNoz, HyperDX or Grafana a better fit?