
Best open source monitoring tools are still relevant because modern infrastructure is more complex, not less. Between cloud services, containers, virtualization, and legacy systems, visibility gaps are easy to create and hard to detect. Systems fail in more subtle ways than outright downtime, and those failures often start long before users notice. Monitoring today is not just about checking whether a server is up, but about understanding performance trends, failure patterns, and capacity limits before they turn into incidents.
Best open source monitoring tools remain attractive because they give you full control over data, alerting logic, and integrations. This matters when you need to adjust thresholds, retention policies, or data models to match real-world behavior instead of vendor defaults. Many teams also value the ability to inspect how a tool works internally rather than treating it as a black box. Over time, this transparency makes it easier to trust the data you rely on during outages.
What to Look for in an Open Source Monitoring Tool
Before naming tools, it helps to define what “good” actually means for your environment. Different teams fail at monitoring for different reasons, and the tooling should match those realities. A small team running a few servers has very different needs from a team operating hundreds of nodes across multiple regions. Choosing tools without this context usually leads to overengineering or blind spots.
Scalability
The tool must handle your expected host count, metric cardinality, or log volume without becoming the bottleneck itself. Some tools work well for ten servers and fall apart at a hundred. Others scale well technically but require architectural changes that increase complexity. Understanding where those limits are helps you avoid painful migrations later.
Signal coverage
Decide whether you need metrics only, or if logs and traces are equally important. Adding everything at once usually creates noise rather than insight. It is often better to start with one signal type and expand when gaps become obvious. This approach keeps dashboards and alerts understandable.
Alerting quality
Alerts should be actionable and understandable. A tool that floods you with alerts but does not help you diagnose the issue is worse than no alerts at all. Good alerting supports escalation, grouping, and clear context. Without that, on-call fatigue becomes inevitable.
Operational overhead
Self-hosting means upgrades, backups, storage tuning, and failure handling. The tool should fit the time and expertise you actually have. A powerful system that no one maintains properly quickly becomes unreliable. Monitoring infrastructure must itself be monitored.
Ecosystem fit
Integration with your OS, virtualization layer, container platform, or network stack matters more than feature checklists. A tool that fits naturally into your environment reduces glue code and manual work. Over time, this integration saves more effort than any single feature.
Metrics Monitoring Tools

Open source server monitoring tools focus on numeric values collected over time, such as CPU usage, memory pressure, disk latency, or request duration. These best open source monitoring tools are usually the backbone of any monitoring setup because they provide structured, queryable data. Metrics allow you to see patterns that are invisible in logs, especially gradual degradation or resource exhaustion. They are also well suited for automated alerting because they are predictable and easy to aggregate.
Metrics-oriented systems typically rely on time-series databases and scheduled data collection. This model works well for both infrastructure and application-level signals when metrics are designed thoughtfully. Poorly designed metrics, however, can explode in cardinality and cause performance issues. Designing metrics is as important as choosing the tool itself.
Metrics tools shine when paired with good dashboards and sane alert thresholds. Dashboards should answer real operational questions rather than display everything available. Alerts should be based on service impact rather than raw resource usage where possible. When metrics are used correctly, they become a reliable early warning system rather than background noise.
Log Monitoring and Aggregation

Logs provide context that metrics cannot. When something breaks, logs often explain why it happened, not just that it happened. They capture application behavior, error messages, and unexpected states that are difficult to model as metrics. During incidents, logs are often the fastest way to confirm assumptions.
Centralized log aggregation allows you to search across systems instead of SSHing into individual servers during incidents. This becomes critical as environments grow and manual inspection no longer scales. Centralization also enables correlation between services and components. Without it, troubleshooting becomes guesswork.
Log tools vary widely in how they store, index, and query data. Some prioritize fast ingestion and simple searching, while others focus on complex indexing and analytics. The right choice depends on whether you mostly troubleshoot incidents or also analyze long-term behavior. Storage requirements and retention policies play a big role here.
Logs work best when they are structured and consistently tagged. Unstructured logs make searching harder and increase storage costs. Consistent fields such as service name, environment, and request ID dramatically improve usability. Investing in log quality pays off every time something goes wrong.
Distributed Tracing and Observability
Tracing becomes important once requests pass through multiple services. In these systems, a single user action can trigger dozens of internal calls. Without tracing, it is hard to know where time is being spent. Traces provide visibility into call chains and dependencies that metrics alone cannot show.
Instead of guessing where latency is introduced, traces show the actual path a request took and how long each step consumed. This makes performance debugging far more deterministic. Tracing is especially useful for identifying slow dependencies or misconfigured timeouts. It also helps validate architectural assumptions.
Tracing is rarely useful on its own. It becomes powerful when you can pivot from a slow trace to the metrics and logs related to the same service or request. This correlation is what turns observability data into insight. For teams running microservices or service-oriented architectures, tracing often becomes essential rather than optional.
Unified Monitoring Platforms
Some open source server monitoring tools aim to cover metrics, alerting, dashboards, and sometimes logs in a single system. These platforms are often designed for broad coverage rather than deep specialization. They can simplify operations by reducing the number of tools you must maintain. For some teams, this trade-off is worth it.
- Broad coverage: Unified platforms can monitor servers, applications, and network components from one place. This reduces context switching during incidents. It also helps teams maintain consistent alerting and visibility across environments.
- Higher complexity: They usually require more tuning and maintenance as environments grow. Configuration can become complex as you add more checks and integrations. Without discipline, these systems can become hard to reason about.
- Faster onboarding: Built-in templates and defaults help teams get useful data quickly. This is valuable for teams with limited monitoring experience. Over time, templates still need customization to reflect real workloads.
Lightweight Monitoring for Small Environments
Not every setup needs a full observability stack, especially when open source system monitoring is sufficient. Smaller infrastructures benefit from tools that provide immediate insight with minimal configuration. These tools focus on essential performance indicators and straightforward alerts. They are often easier to deploy and understand.
Lightweight monitoring is especially useful for development environments, staging systems, or small production setups. It allows teams to catch obvious problems without investing heavily in infrastructure. Many tools in this category emphasize real-time visibility over long-term analysis.
Lightweight monitoring is often a good starting point. As systems grow, teams can gradually add more specialized tools. Starting simple reduces the risk of monitoring fatigue early on. It also helps teams learn what signals actually matter.
Operational Overhead of Self-Hosting
Running open source system monitoring means owning the entire lifecycle. Storage growth, retention policies, backup strategies, and upgrade paths all become your responsibility. Monitoring systems often generate large volumes of data, which must be managed carefully. Ignoring storage planning is a common failure mode.
Some monitoring tools require separate scaling strategies for ingestion, querying, and storage. This adds architectural complexity that must be understood and maintained. High availability setups also increase operational demands. These factors should be considered upfront.
Ignoring this overhead leads to monitoring systems that are fragile or silently failing. A monitoring system that misses data or alerts is worse than none at all. Planning for capacity, failure scenarios, and maintenance is essential. Monitoring must be treated as production infrastructure.
Open Source vs Commercial Monitoring
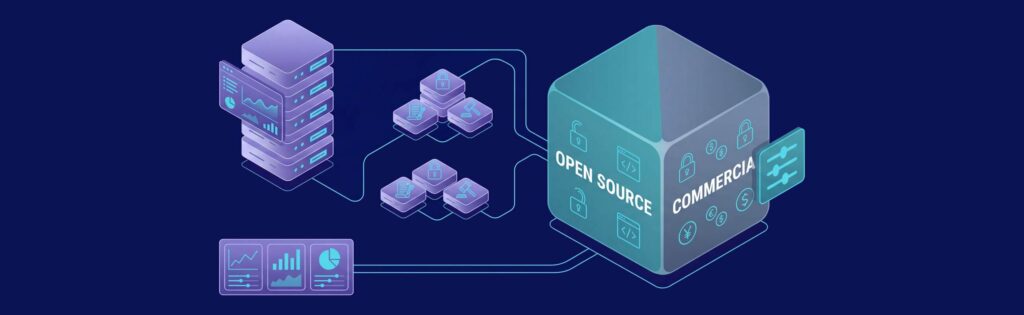
Teams often compare open source monitoring with commercial platforms when deciding how much control versus convenience they want. The differences are less about features and more about long-term operational impact.
- Cost structure: Commercial monitoring platforms typically charge per host, per metric, or per data volume, which makes costs grow unpredictably as environments scale. Open source tools avoid these licensing models, but you pay in infrastructure and engineering time instead. Over time, this trade-off favors teams that can plan capacity and staffing realistically.
- Data ownership: With open source monitoring, all collected data stays in systems you control. This is important for compliance, auditing, and internal analysis. Commercial platforms may limit retention, export options, or query flexibility depending on your plan.
- Operational responsibility: Commercial tools remove much of the maintenance burden by handling upgrades, scaling, and availability. Open source monitoring requires you to manage these aspects yourself, including failures of the monitoring stack itself. This responsibility should not be underestimated.
- Flexibility and customization: Open source tools allow deep customization of metrics, alerts, storage backends, and integrations. Commercial platforms often restrict these options to keep systems standardized. For complex or unusual environments, this flexibility can be decisive.
- Long-term predictability: Open source monitoring provides predictable costs and behavior once the system is stable. Commercial platforms can change pricing, features, or limits over time, which introduces long-term uncertainty. Some teams accept this risk, others actively avoid it.
Choosing the Right Monitoring Stack
There is no single best stack for everyone. The right approach depends on your scale, architecture, and team maturity. Monitoring should reflect how your systems fail in practice, not how diagrams suggest they should.
- Start with metrics to establish baselines and alerts. Metrics give you the quickest return on investment.
- Add centralized logging when troubleshooting becomes painful. Logs provide the details that metrics cannot.
- Introduce tracing when distributed latency becomes hard to explain. Tracing clarifies complex call paths.
- Expand cautiously and based on real problems, not trends. Every new tool adds cognitive and operational load.
Monitoring should reduce stress, not create more of it. A smaller, well-understood stack is usually better than a large, unused one.
Conclusion
Best open source monitoring tools remain a strong choice for teams that value control, transparency, and adaptability. It allows you to build observability around your actual systems rather than vendor assumptions. The ecosystem offers mature tools for metrics, logs, and tracing that can scale with your needs.
The key is not to chase every tool, but to build a stack that reflects how your systems actually behave. When monitoring aligns with reality, it becomes a trusted part of operations. Done well, it improves reliability, reduces firefighting, and supports sustainable growth.
Reliable VPS Hosting for Self-Hosted Monitoring
At VPS.us, we provide high-performance virtual private servers designed for teams that need full control over their infrastructure and monitoring stack. Self-hosting open source monitoring tools require predictable CPU performance, fast NVMe storage, and stable network connectivity, especially when collecting and analyzing metrics, logs, and traces around the clock. We build our VPS platform to support these workloads with isolated, guaranteed resources, unmetered traffic, and full root access so you can install, configure, and scale your monitoring systems exactly how you need them.
For teams running monitoring stacks in the USA, we recommend the KVM8-US plan, which includes 8 vCPU cores, 8 GB of RAM, and 80 GB of NVMe storage, providing a solid balance of performance and capacity for running metrics collectors, dashboards, and alerting systems while leaving room for growth.