
- Nagios: Great for centralized monitoring with customizable alerts and automated recovery.
- Zabbix: Open-source, highly scalable, and ideal for handling large setups with advanced automation.
- Prometheus: Focuses on time-series monitoring and integrates well with Grafana for visualization.
- Datadog: Cloud-based, user-friendly, and supports over 850 integrations, but can be pricey.
- SolarWinds SAM: Designed for enterprise environments with over 1,200 templates and robust cross-platform monitoring.
Quick Comparison
| Tool | Key Features | Best For | Pricing |
|---|---|---|---|
| Nagios | Centralized monitoring, auto recovery | Customizable setups | Free & paid versions |
| Zabbix | Open-source, multi-tenancy | Large-scale, budget-friendly | Free |
| Prometheus | Time-series data, PromQL queries | Trend analysis, scalability | Free |
| Datadog | Cloud-based, real-time tracking | Comprehensive monitoring | Starts at $15/host/month |
| SolarWinds | Enterprise templates, hybrid setups | Complex infrastructures | Starts at $1,886/license |
Each tool has strengths depending on your needs. Read on to explore their features in detail and find the perfect fit for your VPS!
Nagios: Network and System Monitoring
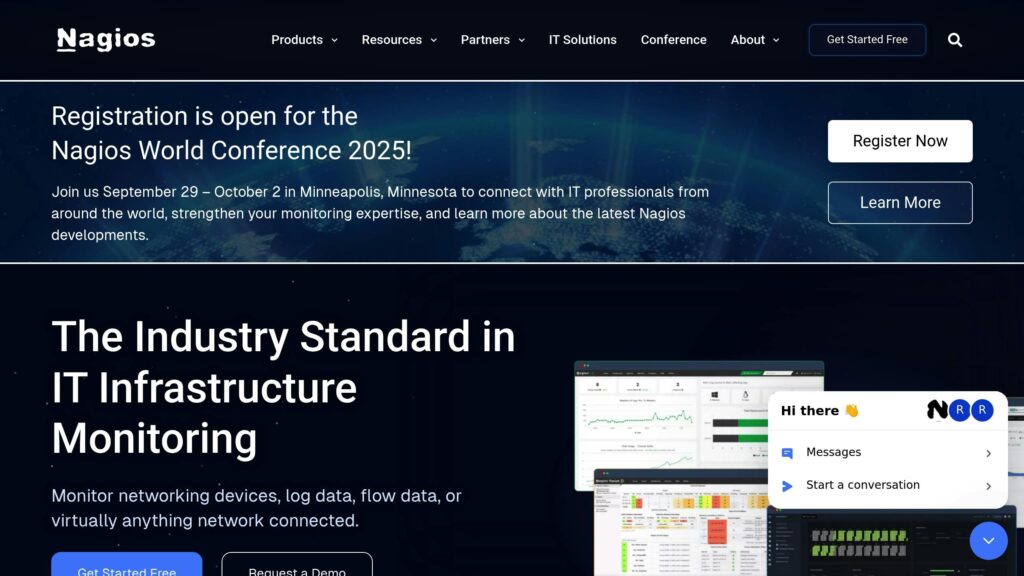
Nagios, used by over 1 million users [3] and refined over more than a decade, offers a solid solution for monitoring VPS environments.
The platform focuses on three key areas that are crucial for managing VPS:
Infrastructure Monitoring
- Keeps an eye on resources across Windows, Linux, and UNIX systems.
- Tracks vital services like Apache, IIS, DNS, and email servers.
- Monitors storage usage and file system health.
- Works with both agent-based and agentless setups [4].
Alert Management
Nagios features a powerful alert system designed to minimize downtime. It sends instant notifications via email or SMS, restarts failed services automatically, triggers custom event handlers, and suppresses alerts during maintenance periods [3].
Integration Capabilities
Nagios offers a wide range of integration options, including:
- API access for connecting with third-party tools.
- A library of over 4,000 plugins created by the community [5].
- Custom add-ons for tracking trends and planning capacity.
- A multi-user web interface for team collaboration [3].
| Feature | How It Helps VPS Users |
|---|---|
| Centralized Monitoring | View all VPS metrics in one dashboard. |
| Automated Recovery | Minimizes downtime by restarting services. |
| Customizable Alerts | Ensures the right team gets critical updates. |
| Scalable Architecture | Handles growing infrastructure seamlessly. |
Though Nagios requires command-line configurations [6], which can be challenging to learn, this complexity allows for a high degree of customization tailored to VPS monitoring needs.
“Nagios solutions empower you to monitor the components that are most critical to your IT infrastructure, such as applications, operating systems, websites, databases, log files, NetFlow, and much more!”
– Nagios [5]
For VPS setups that demand detailed monitoring and tailored alert workflows, Nagios provides a reliable and flexible option to maintain performance and avoid outages. Up next, take a look at Zabbix’s open-source monitoring approach.
Zabbix: Open-Source Monitoring Platform
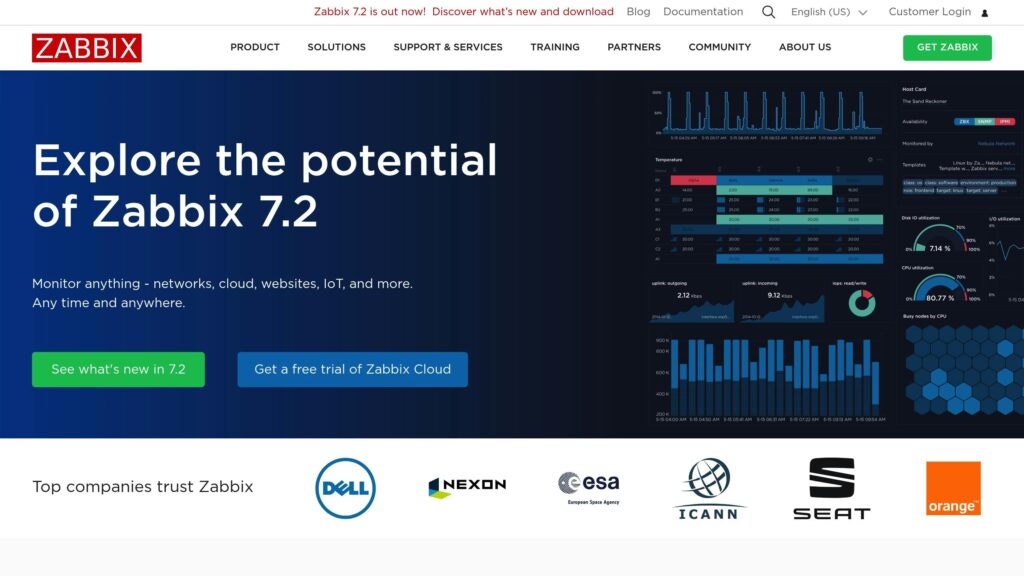
Zabbix is an open-source monitoring solution with a 100% repurchase intent and a 93% satisfaction rating [9]. Known for its stability and easy deployment, it’s a reliable choice for VPS monitoring in enterprise environments.
Core Monitoring Features
The Zabbix agent is designed to collect metrics efficiently across various operating systems [8]. It supports multiple data collection methods, all with a minimum polling interval of just one second:
| Collection Method | Supported Protocols | Minimum Polling Interval |
|---|---|---|
| Agent-based | Native Zabbix agent | 1 second |
| Agentless | SNMP, IPMI, SSH/Telnet | 1 second |
| Application | Java, ODBC, Prometheus | 1 second |
| Network | ICMP, TCP | 1 second |
Advanced Capabilities
Zabbix simplifies monitoring with automated features:
- Device and service discovery
- Root cause analysis
- Script-based remediation
- Real-time data transformation (supports formats like JSON, XML, CSV)
- Customizable anomaly thresholds
Visualization and Reporting
Zabbix offers tools to make data analysis straightforward:
- Dashboards with customizable widgets
- Performance graphs
- Geographic maps
- Infrastructure topology views
- Scheduled reporting options
Security and Scalability
Zabbix is built to handle expanding VPS environments with features such as:
- Encrypted communication
- Granular user permissions
- Support for multi-tenancy
- Distributed monitoring capabilities
- High availability setups [8]
For deployments exceeding 1,000 hosts, Zabbix is often more budget-friendly than SaaS alternatives [9]. Its templating system streamlines server group management, and its built-in alerting and visualization tools reduce the need for additional software [10].
Thanks to its detailed documentation and customizable framework, Zabbix is particularly well-suited for VPS environments that demand both flexibility and scalability. This combination of features and affordability makes it a standout option for VPS monitoring. Up next, we’ll dive into Prometheus and its focus on time-series monitoring./banner/inline/?id=sbb-itb-0ad7fa2
Prometheus: Time-Series Monitoring
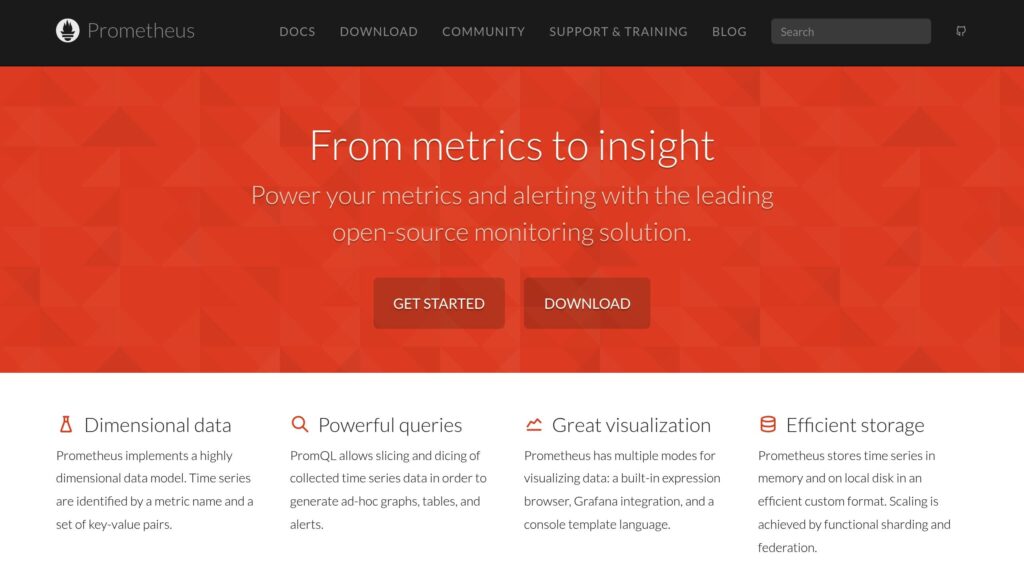
Prometheus is a time-series monitoring tool designed for VPS environments. Since becoming part of the Cloud Native Computing Foundation in 2016 as its second project after Kubernetes [11], it has become a key player in modern monitoring systems.
Core Architecture
Prometheus uses a pull-based model over HTTP to gather metrics at regular intervals. It records numerical time-series data and stores it both in memory and on local disk using a custom format. This setup allows for efficient collection and analysis of VPS metrics.
Monitoring Features
Prometheus operates with a multi-dimensional data model, tracking metrics through key-value pairs. Its standalone design ensures it keeps running even during outages, making it a dependable choice for critical VPS monitoring [11].
Some standout features include:
- Query Language: PromQL enables complex queries for analyzing time-series data [12].
- Alert Management: Prometheus works with Alertmanager to support detailed alert definitions, smart routing, notification deduplication, and integration with external systems.
Performance Optimization Tips
To get the most out of Prometheus, consider these strategies [12]:
- Adjust scrape intervals based on resource limits. For instance, shorter intervals (e.g., 15 seconds) generate significantly more metrics than longer ones (e.g., 1 minute).
- Use label-based filtering to refine metric selection.
- Set manageable metric retention periods to avoid overloading storage.
- Opt for longer evaluation intervals for alerts to minimize false positives.
Integration Capabilities
Prometheus works well with visualization tools like Grafana. This pairing lets you create real-time dashboards, set custom alert thresholds, analyze trends, and monitor resource usage effectively.
For VPS environments, Prometheus strikes a balance between reliability and scalability. Its focus on time-series data makes it an essential tool for identifying performance trends and addressing issues before they escalate. Up next, we’ll look at how cloud-based monitoring tools can further improve VPS management.
Datadog: Cloud-Based Monitoring
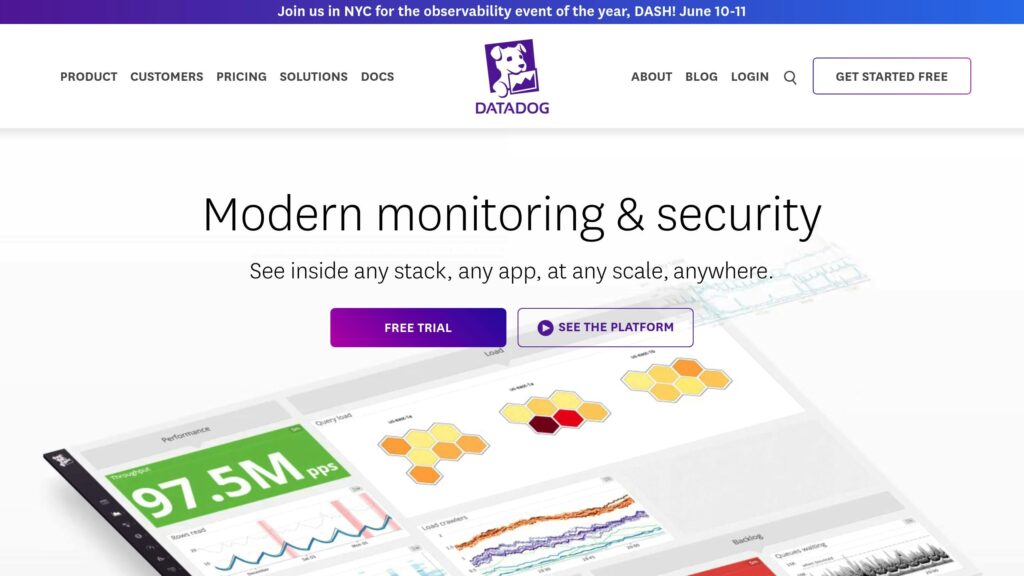
Datadog is a cloud-based platform designed to monitor VPS environments. It combines infrastructure monitoring, application tracking, and security in one place.
Core Monitoring Features
Datadog’s infrastructure monitoring provides real-time insights through an agent that connects metrics, traces, and logs to help resolve host issues. It supports more than 850 integrations, including AWS, Azure, and Google Cloud. Some standout features include:
- Real-time performance tracking: Monitors CPU, memory, and network metrics.
- Anomaly detection: Identifies unusual patterns automatically.
- Network device monitoring: Compatible with tools like Cisco Meraki [13][14].
Integration and Deployment
The Datadog Agent works with a wide range of operating systems commonly used in VPS setups. Its Autodiscovery feature simplifies container monitoring by automatically configuring settings [15].
Pricing Structure
| Plan Type | Annual Cost (per host/month) | Monthly Cost (per host/month) |
|---|---|---|
| Infrastructure Monitoring | $15 | $18 |
| APM | $31 | $36 |
| Security Monitoring (Pro) | $10 | $25 (Enterprise) |
For log management, indexed logs cost $0.10 per GB, while ingested events are priced at $1.27 per million events [16].
Performance Optimization Tips
To keep costs under control, consider these strategies:
- Use smart sampling.
- Focus on monitoring key conversion funnels.
- Set shorter retention periods for less critical data [16].
Enterprise Scalability
Datadog is built to handle large-scale systems, offering integrations with tools like Hadoop and Spark. It monitors various infrastructures, including bare metal servers, virtual machines, and private clouds, ensuring seamless coverage as your setup expands [14].
Although Datadog provides extensive features and integrations, its pricing can add up for larger teams or those managing high data volumes [16]. However, its user-friendly design and easy deployment make it appealing for organizations that value comprehensive monitoring over cost [7].
SolarWinds Server & Application Monitor: Enterprise Monitoring
For enterprise organizations managing large-scale, critical environments, SolarWinds Server & Application Monitor (SAM) provides a tailored solution. Unlike general cloud-based tools like Datadog, SAM is designed specifically for VPS environments, offering over 1,200 pre-built monitoring templates to ensure peak performance and reliability.
Performance Monitoring Capabilities
SAM uses PerfStack™ for cross-stack IT correlation and AppStack™ to map application components. These tools enable faster issue identification and troubleshooting – up to 65% quicker – helping teams resolve problems efficiently [18][21].
Cloud Integration Features
SAM stands out with its ability to monitor cloud resources across diverse environments:
| Environment Type | Monitoring Capabilities |
|---|---|
| On-premises | Tracks server hardware, applications, and dependencies |
| Cloud Services | Monitors AWS EC2, Azure VMs, IaaS, and PaaS |
| Hybrid | Provides unified visibility and cross-platform correlation |
| Container Services | Supports Docker, Kubernetes, and Apache Mesos |
These features allow businesses to monitor complex setups with ease, enhancing their overall system management.
ROI and Implementation Benefits
Organizations using SAM report impressive results:
- 70% of users recovered costs within six months.
- 18% achieved ROI in less than one month.
- Reduced Mean Time to Detect (MTTD) and Mean Time to Resolve (MTTR) by up to 50% [21].
Enterprise Pricing Structure
SAM offers flexible pricing options:
- Perpetual license starting at $1,886
- Subscription plans for 1, 3, or 5 years
- A 30-day free trial to test its capabilities [19].
Real-World Impact
SAM’s practical benefits are evident in user feedback:
“One of the big benefits is the correlation of moment-in-time data. We can get to the issue faster. We can be more dependable for our customers and our clients. If a problem happens, we can prevent it from reoccurring.” – Justin Diana, VP of Information Technology, Corevist [17]
The platform’s dynamic thresholds and automated configurations have redefined how enterprises approach VPS monitoring. With hardware health monitoring, teams can proactively address potential issues before they disrupt operations [20].
Advanced Monitoring Features
SAM includes a range of advanced tools:
- Agentless monitoring for both Windows and Linux
- Automatic discovery of server and application dependencies
- Remote process management and resource optimization
- Customizable reporting and alerting
- Real-time task visibility [22]
This comprehensive feature set makes SAM a powerful choice for organizations looking to streamline their monitoring processes.
Conclusion
Selecting the right VPS monitoring tool is crucial for maintaining performance, security, and reliability. With a variety of options available, it’s important to match the tool to your specific needs and operational scale.
Key Selection Criteria
When evaluating monitoring tools, keep these factors in mind:
| Factor | What to Consider | Why It Matters |
|---|---|---|
| Scalability | Can it handle future growth and resource demands? | Impacts long-term usability and costs |
| Integration | Does it work with your current setup? | Ensures smooth implementation |
| Features | What metrics and alerts does it cover? | Affects how efficiently you can operate |
| Cost Structure | What are the upfront and recurring costs? | Influences the overall budget and ROI |
Tool Recommendations for Different Needs
Your choice of monitoring tool should align with your environment. For enterprise-level operations, platforms like SolarWinds or Datadog offer advanced analytics and extensive integration capabilities. These tools are well-suited for large-scale setups requiring detailed insights and robust performance tracking.
Best Practices for Effective Monitoring
To get the most out of your monitoring setup, follow these strategies:
- Start with cloud-based platforms to simplify deployment [7]
- Track critical metrics like CPU, RAM, and storage usage [1]
- Set up alerts for unusual resource activity [23]
As your needs evolve, consider tools with predictive analytics and automation, such as Prometheus combined with Grafana. These provide advanced data visualization and modeling, making them ideal for scaling organizations.
Whether you choose Datadog, SolarWinds, Zabbix, Nagios, or Prometheus, ensure the tool aligns with your VPS requirements while offering room for growth. Reliable monitoring is key to keeping your VPS infrastructure stable and efficient.