
Virtual Private Servers are a popular choice for hosting applications and services, offering scalability and flexibility. However, like any shared-resource environment, they can sometimes experience performance issues that disrupt operations and degrade user experience. Identifying the root cause of a slow VPS is crucial for effective troubleshooting. This guide provides a detailed, step-by-step high level approach to diagnose and address such issues.
Step 1: Define the Symptoms
The troubleshooting process begins with clearly identifying the symptoms of poor VPS performance. Monitor for high latency, slow application response times, or service crashes. Note whether these issues affect specific services or the entire VPS, and if they occur persistently or intermittently.
Compare your allocated resources against actual usage using your provider’s control panel or monitoring tools to establish baseline metrics. It will give you a first hand insights on the situation.
Here is a control panel example:
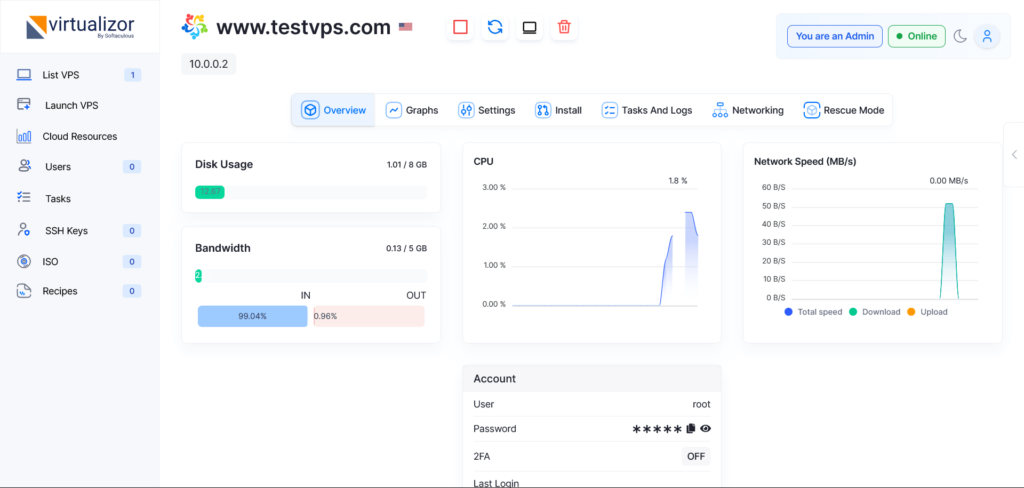
Step 2: Identify Resources Bottleneck
The next step consist in identifying which resources is actually the cause of your performances degradation.
There are 3 main ressources that shapes your VPS: CPU, RAM, Disk and the Network. Here is an approach to diagnose all 4.
CPU Usage
A VPS may experience slowness if the CPU is overutilized due to heavy workloads, inefficient processes, or contention in shared environments, as high CPU usage forces tasks to queue, delaying execution and slowing overall performance.
Run top or htop to identify processes consuming CPU:
top
An alternative is to install htop and run it:
htop
The top command is a real-time system monitoring tool that provides an overview of running processes, CPU and memory usage, and other key metrics, helping administrators identify resource-intensive processes and system bottlenecks.
| top Metrics | Description |
|---|---|
| PID | Process ID of the running task. |
| USER | User account under which the process is running. |
| PR | Priority of the process. Lower values mean higher priority. |
| NI | Nice value of the process, affecting its priority. |
| VIRT | Total virtual memory used by the process (includes RAM and swap). |
| RES | Resident memory used by the process (physical RAM). |
| SHR | Shared memory used by the process (e.g., shared libraries). |
| %CPU | Percentage of CPU time used by the process. |
| %MEM | Percentage of physical memory used by the process. |
| TIME+ | Total CPU time the process has consumed since it started. |
| COMMAND | Name of the process or command being executed. |
| Tasks | Total number of processes and their states (e.g., running, sleeping). |
| Load Average | Average number of processes waiting for CPU over 1, 5, and 15 minutes. |
| CPU Usage | CPU utilization split into user, system, I/O wait, and idle percentages. |
| Memory Usage | Statistics for total, used, free, and cached physical memory. |
| Swap Usage | Statistics for total, used, and free swap memory. |
Monitor for sustained high CPU usage, and if specific processes are consuming excessive resources, investigate and optimize them accordingly.
Memory (RAM)
A VPS may slow down if its RAM is insufficient, causing the system to rely on slower swap memory stored on disk, but it’s important to note that Linux efficiently utilizes RAM for performance; so focus on high swap usage, rather than full RAM, as the reliance on slower disks forces the CPU to wait for data retrieval.
Review Your RAM with free
free -h
The free -h command displays memory usage in a human-readable format, showing RAM and swap details. Here’s how to interpret its output:
| free Metrics | Description |
|---|---|
| Total | Total available physical RAM or swap space. |
| Used | Amount of memory currently in use by processes and the system. |
| Free | Unused memory immediately available. |
| Shared | Memory used by temporary file systems (e.g., /dev/shm). |
| Buffers/Cache | Memory used for disk caching, which can be quickly freed if needed. |
| Available | Memory available for new processes, accounting for buffers and cache reclaim. |
Review Your RAM with vmstat
Alternatively, you may run the vmstat command.
vmstat
The vmstat command provides a detailed snapshot of system performance, including CPU, memory, and I/O activity, helping administrators identify bottlenecks and monitor overall system health.
| vmstat Metrics | Description |
|---|---|
| procs (r) | Number of processes waiting for CPU time. |
| procs (b) | Number of processes in uninterruptible sleep (usually I/O wait). |
| memory (swpd) | Amount of virtual memory used (in KB). |
| memory (free) | Amount of idle memory available (in KB). |
| memory (buff) | Memory used as buffers (in KB). |
| memory (cache) | Memory used as cache (in KB). |
| swap (si) | Amount of memory swapped in from disk (in KB/s). |
| swap (so) | Amount of memory swapped out to disk (in KB/s). |
| io (bi) | Blocks received from a block device (in KB/s). |
| io (bo) | Blocks sent to a block device (in KB/s). |
| system (in) | Number of interrupts per second, including the clock. |
| system (cs) | Number of context switches per second. |
| cpu (us) | Percentage of CPU time spent on user processes. |
| cpu (sy) | Percentage of CPU time spent on system/kernel processes. |
| cpu (id) | Percentage of idle CPU time. |
| cpu (wa) | Percentage of CPU time spent waiting for I/O operations. |
| cpu (st) | Percentage of CPU time stolen by the hypervisor for other tasks. |
Review your RAM with ps aux
Investigate memory-hungry processes using:
ps aux --sort=-%mem
Once you run the command, you’ll obtain a list of processes sorted by their RAM usage. Investigate the top processes which are being returned.
| ps aux Metrics | Description |
|---|---|
| USER | The username of the process owner. |
| PID | Process ID of the task. |
| %CPU | Percentage of CPU usage by the process. |
| %MEM | Percentage of memory usage by the process. |
| VSZ | Virtual memory size (in KB). |
| RSS | Resident Set Size – physical memory used (in KB). |
| TTY | Controlling terminal for the process, if any. |
| STAT | Current status of the process (e.g., R for running, S for sleeping). |
| START | Start time or date of the process. |
| TIME | Total CPU time used by the process. |
| COMMAND | The command with options used to start the process. |
Disk Usage, I/O & Filsystem Corruption
A VPS may slow down if disk usage and I/O are high, as frequent read/write operations can overwhelm the storage, leading to latency and reduced performance; Linux typically handles disk I/O efficiently, but excessive disk activity often signals underlying issues such as inadequate RAM, fragmented storage, or resource-intensive applications that force the system to wait for data access, significantly slowing down overall operations.
Review Your Disk Space Usage
First, check disk space usage with
df -h
So, if one of your partition is reaching close to 100%, list out your most important directories for a clean up using:
du -ah /path/to/partition | sort -rh | head -n 20
or the top 20 files with:
find /path/to/partition -type f -exec du -h {} + | sort -rh | head -n 20Review Your Disk I/O with iotop
Then, if your storage is fine, analyze I/O wait using either iotop or instat. While storage is about actual space, I/O measures the speed of your disk which also has its limits. A slow disk will cause high CPU loads as it will idle while waiting for the data.
iotop
High SWAPIN or IO% indicates processes are waiting for I/O operations, potentially due to slow disks or high swap usage.
Identify processes with the highest DISK READ/WRITE and investigate their behavior, here is a recapitulative table on how to interpret the iotop command
| IOTOP Metrics | Description |
|---|---|
| Total DISK READ | Total amount of data being read from disk across all processes (real-time). |
| Total DISK WRITE | Total amount of data being written to disk across all processes (real-time). |
| PID | Process ID of the task consuming I/O. |
| PRIO | Priority of the process. |
| USER | User running the process. |
| DISK READ | Disk read activity of the specific process in KB/s. |
| DISK WRITE | Disk write activity of the specific process in KB/s. |
| SWAPIN | Percentage of time the process spends swapping. |
| IO | Percentage of time the process is waiting for I/O to complete. |
Review Your Disk I/O with iostat
Alternatively, you can run iostat. It’s a Linux command-line tool that provides detailed statistics on CPU usage and disk I/O performance, helping identify bottlenecks and monitor system resource utilization.
- %util close to 100% indicates the disk is at its capacity.
- High await values (>10 ms for SSDs, >50 ms for HDDs) suggest storage latency issues.
- Check tps and kB_read/s to understand the volume and speed of I/O
iostat -x 1 3
| IOSTAT Metrics | Description |
|---|---|
| tps | Transactions per second (number of I/O requests). |
| kB_read/s | Kilobytes read from the disk per second. |
| kB_wrtn/s | Kilobytes written to the disk per second. |
| kB_read | Total kilobytes read since the system started. |
| kB_wrtn | Total kilobytes written since the system started. |
| %util | Percentage of time the disk is busy servicing requests (100% indicates bottleneck). |
| await | Average wait time (ms) for I/O requests. |
| avgqu-sz | Average queue size of I/O requests waiting to be processed. |
Review Your Filesystem Integrity
In last resort, you may check for file system errors which could reflect a corrupted virtual storage.
dmesg | grep -i error
Here are some typical corruption patterns to look for which would require an intervention from your VPS hosting support. Additionally, should any of these errors arises, verifying your data’s backup is mandatory.
I/O Errors
[12345.678901] blk_update_request: I/O error, dev sda, sector 1234567
[12345.678902] Buffer I/O error on dev sda1, logical block 1234, async page read
File System Errors
[12345.678903] EXT4-fs error (device sda1): ext4_find_entry:1456: inode #123456: comm process_name: reading directory lblock 0
[12345.678904] EXT4-fs error (device sda1): ext4_journal_check_start:56: Detected aborted journal
[12345.678905] EXT4-fs (sda1): Remounting filesystem read-only
Super-block Issues
[12345.678906] EXT4-fs (sda1): unable to read superblock
Metadata Corruption
[12345.678907] XFS (sda1): Metadata corruption detected at xfs_buf_ioerror
General Disk Errors
[12345.678908] ata1.00: failed command: READ DMA
[12345.678909] ata1.00: status: { DRDY ERR }
[12345.678910] ata1.00: error: { UNC }
Bandwidth and Network
Consequences of Network Issue
Network issues can cause a VPS to be slow due to the following reasons:
- Bandwidth Limitation: If the VPS exceeds its allocated bandwidth, traffic may be throttled, leading to slower data transfer.
- High Latency: Poor network routing, physical distance to clients, or overloaded network infrastructure can increase response times.
- Packet Loss: Dropped packets due to network congestion or faulty hardware require retransmissions, slowing down data flow.
- Overloaded Network Interface: If the VPS’s NIC (Network Interface Card) is overwhelmed by high traffic, it can create bottlenecks.
- DDoS Attacks: Distributed Denial of Service attacks targeting the VPS or its network can overwhelm resources, leading to slow performance.
- Shared Network Environment: In a shared hosting environment, other VPS instances using the same physical network can cause contention and slowdowns.
- Misconfigured Firewall or Network Rules: Inefficient or overly restrictive rules can delay or block legitimate traffic.
- DNS Issues: Slow or misconfigured DNS servers can lead to delays in resolving domain names
Troubleshooting a Network Issue
Start by monitoring network traffic with the following commands:
Review your Network with vnstat
vnstat
Vnstat is a lightweight network traffic monitoring tool that tracks and reports incoming and outgoing data usage for network interfaces over time, making it ideal for identifying bandwidth trends and usage patterns.
| vnstat Metrics | Description |
|---|---|
| Interface | The name of the network interface being monitored (e.g., eth0, wlan0). |
| rx | Total amount of received (downloaded) data on the interface. |
| tx | Total amount of transmitted (uploaded) data on the interface. |
| today | Data usage (received and transmitted) for the current day. |
| monthly | Aggregated data usage statistics (received and transmitted) for each month. |
| hourly | Hourly breakdown of data usage, useful for identifying peak traffic times. |
| total | Cumulative total of data usage across all monitoring periods. |
| rate | Current data transfer rate for the interface in real-time. |
| time | Timestamp indicating when the last update to the data statistics occurred. |
Review Your Network with iftop
Alternatively, the iftop command is a real-time bandwidth monitoring tool that displays the current network traffic on a specific interface, showing which connections are consuming the most bandwidth.
iftop
Here is how to interpret the output of the command:
| iftop Metrics | Description |
|---|---|
| TX | Amount of transmitted (outgoing) data for a specific connection in real-time. |
| RX | Amount of received (incoming) data for a specific connection in real-time. |
| TX Rate | Current transmission speed for a connection (e.g., Kbps, Mbps). |
| RX Rate | Current reception speed for a connection (e.g., Kbps, Mbps). |
| Total TX | Total amount of transmitted data for a connection since iftop started. |
| Total RX | Total amount of received data for a connection since iftop started. |
| Bandwidth Usage Bars | Graphical bars showing bandwidth usage for each connection in a relative manner. |
| Host | The IP or hostname of the source or destination of the connection. |
| Intervals (1s, 10s, 40s) | Average data rates over short (1-second), medium (10-second), and long (40-second) intervals. |
Finally, test your network latency and packet loss:
ping -c 5 <destination_IP> traceroute <destination_IP>
Persistent latency or packet loss may indicate network issues.
Step 3: Review Your Stack
Server stack misconfigurations can cause a VPS to slow down due to the main following reasons:
- Inefficient Resource Allocation: Poorly tuned server components like web servers, databases, or caching mechanisms may consume excessive CPU, RAM, or I/O, leading to bottlenecks. (Refer to the previous part)
- Error-Prone Configurations: Misconfigurations in web servers (e.g., Nginx, Apache) or databases (e.g., MySQL) can lead to errors, timeouts, or excessive load. While this is as wide as there is stack types, we will cover the main cases below.
- Unoptimized Logging: High verbosity in logging or unnecessary debug logs may consume disk space and I/O resources.
- Outdated Software: Running outdated server software or dependencies can lead to inefficiencies and compatibility issues.
- Lack of Caching: Missing or improperly configured caching mechanisms (e.g., Redis, Memcached) can increase the load on both the database and application servers.
Let’s dive on the most common stack made of a Web Server or a Database.
Web Server (e.g., Apache, NGINX)
Server stack misconfigurations often contribute to VPS slowdowns. Focus on analyzing logs, here are their locations:
# Nginx Logs
/var/log/nginx/access.log
/var/log/nginx/error.log

# Apache Logs

/var/log/apache2/access.log
/var/log/apache2/error.log
What are you looking for in web logs?
- High Traffic Spikes:Check for a large number of requests within a short time. This could indicate heavy legitimate traffic or a DDoS attack.
- Frequent Requests to Specific Pages: Look for excessive hits or repeated requests on resource-heavy pages, like large scripts or dynamic PHP pages.
- Unusual User Agents or IP Addresses: Watch for unknown or suspicious user agents (e.g., bots or automated tools) or Multiple requests from a single IP could indicate a DoS attack or brute force attempts.
- Request Patterns: Excessive POST requests (e.g., forms) could indicate spam or login brute-force attacks.
What to do upon meeting any of these patterns?
- Block Suspicious IPs: Use a firewall or .htaccess to block abusive traffic.
- Optimize Scripts: Cache heavy pages or scripts using tools like Redis Cache or Varnish.
- Rate Limiting: Limit requests to prevent bots or scrapers from overloading the server.
- Offload Traffic: Use a CDN to serve static assets and reduce server load.
- Upgrade Resources: If traffic is legitimate, consider upgrading your VPS or adding a load balancer for better performance.
Databases
/var/log/mysql/error.log
What are you looking for in SQL logs?
- Buffer Pool Utilization (e.g., innodb_buffer_pool_size)
- Long-Running Queries
- Lock Contentions
- Connection Pool Exhaustion
- Timeout Errors (e.g., [error] client 192.168.1.1: request timed out)
- Memory Allocation Failures (e.g., [crit] memory allocation failed for connection buffer)
Investigate slow queries
SHOW FULL PROCESSLIST;
This command displays active database connections and queries. It provides details like the connection ID, user, host, database in use, and the type of command being executed (e.g., “Query” or “Sleep”). Look for long-running queries or operations stuck in “Locked” or “Waiting” states, as these may indicate performance bottlenecks or contention issues. Reviewing this list helps identify problematic queries or overloaded connections that need optimization.
Tune your MySQL Server
Proper MySQL server tuning is essential to ensure optimal performance, stability, and efficient resource utilization, especially as workloads grow. You can use MySQLTuner which a Perl-based script that analyzes your MySQL or MariaDB server’s performance and provides actionable recommendations to optimize configuration and resource usage.
wget https://raw.githubusercontent.com/major/MySQLTuner-perl/master/mysqltuner.pl
chmod +x mysqltuner.pl
./mysqltuner.pl
The tool will provide suggestion on tweaking your MySQL server.
Step 4: Evaluate External Factors
Traffic Spikes
Review traffic analytics (e.g., Google Analytics, server logs).
Unexpected spikes may indicate legitimate surges or DDoS attacks.
Mitigate DDoS attacks using firewalls or CDNs like Cloudflare.
Background Processes
Identify and terminate unnecessary background service:
systemctl list-units --type=service
Disable or limit resource-intensive cron jobs.
Run Benchmarks
Running benchmarks extends the diagnosis
Test CPU performance
sysbench --test=cpu --cpu-max-prime=20000 run
Test disk performance:
dd if=/dev/zero of=testfile bs=1G count=1 oflag=dsync
Slow results indicate potential disk or node issues.
Packet Capture
Use tools like tcpdump to diagnose detailed network issues:
tcpdump -i eth0
Step 5: Consider Long-Term Solutions
Once technical factors & external factors you have control on are addressed and your VPS is still slow, it is time to consider more definitive options such as:
- Upgrade VPS Plan: If consistently hitting limits, upgrade to a plan with more resources.
- Switch Providers: If performance issues persist despite troubleshooting, odds are it is coming from your web hosting provider. There are many invisible parts to a VPS such as hardware used, nodes density, VPS neighbors, peering providers, servers locations which are true limits to your VPS experience not being advertised.
- Optimize Applications: Regularly audit and optimize your application stack. There are high levels tuning you can apply or even spread the load across several. You may consider changing your application stack. (we have a set up guide for Apache) such as moving from MySQL to MariaDB or Apache to NGINX…
- Implement Monitoring: Use tools like Prometheus, Grafana, or Datadog to catch issues early or identify & logs patterns. There are also solutions such as Munin which are trivial to set and produces what you need.
Conclusion
By systematically following these steps—identifying symptoms, analyzing resources, evaluating applications, considering external factors, isolating provider issues, and implementing long-term solutions—you can effectively pinpoint the root cause of slow VPS performance.
VPS Performances FAQ
We have compiled more questions we have gathered from online communities with a helpful definitive answers to each:
Why is my VPS so slow all of a sudden?
A sudden slowdown of your VPS can be caused by several factors:
- Resource Contention: Since your VPS shares hardware with other tenants, resource spikes from neighboring servers can impact performance. Oversold or overloaded nodes can cause random slowness if not cared by your upstream provider.
- High Workload: Increased traffic, running resource-intensive applications, or misconfigured services (e.g., memory leaks) can overwhelm CPU, RAM, or storage.
- Random Disk I/O Bottlenecks: Excessive read/write operations on shared storage or slow disk drives can delay application response times. These issues can be intermittent and hard to troubleshoot. Selecting your VPS providers is crucial to prevent these issues.
- Network Issues: Sudden bandwidth saturation or DDoS attacks can throttle connectivity. Poor peering routes, packet loss, or high latency from your provider’s network can degrade performance. Yet again, finding a provider that controls their peering contracts (like we do) is something that is never advertised but essential in delivering a great network.
- Software Updates or Changes: Recent updates or misconfigurations (e.g., installing heavy software) can increase resource usage unexpectedly.
- Background Processes: Scheduled tasks (backups, cron jobs) or malicious scripts (e.g., crypto mining malware) running unnoticed can spike usage. Refer to Our Step 2 or this to quickly reveal these. You may also detect it upon periodic spike in resources usage.
What happens if my VPS runs out of resources?
If your VPS runs out of resources, several issues can occur:
- Out of RAM: The system may start swapping to disk (if swap space is available), drastically reducing performance due to slow disk I/O. Without swap, processes can crash or be killed by the system (via the OOM killer), often affecting critical services.
- CPU Overload: Tasks may queue, causing delays and sluggish performance. Applications may become unresponsive, and high CPU contention can worsen response times for all processes.
- Disk Space Exhaustion: The system may be unable to write new files, causing services like databases, logging, or updates to fail. Temporary files and caches may fail to generate, leading to errors.
- Bandwidth/Network Limits: If you hit bandwidth caps, your VPS may be throttled to a slower speed or temporarily suspended, causing degraded or complete loss of service.
In severe cases, a resource-starved VPS may crash or experience significant downtime.
What is more important in a VPS, RAM or CPU speed?
The importance of RAM versus CPU speed in a VPS depends on the use case:
- RAM is more important for applications that handle large datasets, run many simultaneous processes, or require significant caching, such as databases, web servers, and hosting multiple websites. Insufficient RAM causes disk swapping, drastically reducing performance.
- CPU speed is critical for tasks requiring heavy computations, such as data processing, video encoding, or high-traffic applications with complex back-end logic. A faster CPU ensures quicker task execution and better responsiveness under load.
In general, for web hosting and most VPS workloads, RAM is often more critical because it determines how many tasks the server can handle simultaneously. However, for compute-heavy workloads, CPU speed takes priority. The ideal balance depends on the specific application needs.
What makes a network server slow?
A network server can slow down due to shared VPS resources, where CPU, RAM, and storage are overburdened by other tenants on the same host. Limited or oversold resources result in delays, especially during peak usage. Slow storage or insufficient RAM worsens the issue by increasing disk swapping.
Network-related factors, such as poor peering locations, significantly impact performance. If the server’s provider lacks well-distributed peering agreements, data may travel inefficient or lengthy routes, increasing latency and slowing data delivery. This is often more critical than bandwidth, as closer and more efficient peering locations reduce delays and improve responsiveness. There quite a few large providers afflicted by poor peering routes. The most obvious tell to spot is upon opening your first SSH session which in spite of low latency (<30 ms) isn’t loaded instantly.
Misconfigurations also contribute to slowness. Inefficient web server or database setups and low connection limits can bottleneck performance. Combined with high network latency or packet loss, these issues magnify the impact of poor infrastructure and peering.
Why a VPS is Slower Than Shared Hosting After Migration
That’s a common and fair question. You have selected your VPS Provider or upgraded from Shared to VPS and after quite some migrations hassles, you are expreinceing worse performances and you wonder why.
There are quite a few reasons that could lead to such missues.
Shared hosting servers are quite optimized to run and mitigate some ressrouces such as a mail server, a DNS server, your FTP server, PHP workers and so on. They are shared but each components comes iwth a resources footprint which has a greater unit ressources toll on your VPS. Refer to our application part as it is your starting point to optimize the resources footprints.
How to Isolate VPS Provider Issues
If you suspect provider-related problems:
- Key Revealing Metrics: Check if your VPS faces high CPU steal, I/O wait, or network congestion. Unfortunately, in most providers (not VPS.us) the burden of proof is yours.
- Document Findings: Using this Guide, Record metrics over time to establish patterns.
- Contact Support: Provide logs, benchmarks, and findings to escalate the issue.