Need to optimize your KVM VPS hosting performance? Application Performance Monitoring (APM) tools are essential for reducing downtime, improving response times, and tracking critical metrics like CPU, memory, and network usage. Here’s a quick look at the top 10 APM tools tailored for KVM VPS environments:
- New Relic: Full-stack observability with real-time insights and customizable alerts.
- Datadog: Unified monitoring for infrastructure, applications, and networks with smart anomaly detection.
- Dynatrace: AI-powered, automatic root-cause analysis with dynamic baselines.
- SolarWinds SAM: Agentless monitoring with pre-built templates for server and application performance.
- Prometheus + Grafana: Open-source, customizable monitoring with powerful visualization dashboards.
- AppDynamics: Business transaction monitoring with detailed flow maps and AI-driven alerts.
- Elastic APM: Seamless integration with Elastic Stack for application and system monitoring.
- Nagios XI: Plugin-based, real-time monitoring with flexible alert management.
- Zabbix: Scalable open-source monitoring with active and passive checks.
- ManageEngine Applications Manager: Proactive monitoring with real-time updates and automatic VM discovery.
Quick Comparison
| APM Tool | Real-Time Monitoring | Alerting System | Ease of Integration | Best For | Starting Price |
|---|---|---|---|---|---|
| New Relic | Yes | Custom thresholds, multi-channel | Easy | Smaller setups | Free tier available |
| Datadog | Yes | Smart anomaly detection | Simple | Larger deployments | $31/host/month |
| Dynatrace | Yes | AI-driven, proactive alerts | Automated | Enterprise environments | Custom pricing |
| SolarWinds SAM | Yes | Context-rich notifications | Straightforward | Windows/Linux systems | Annual subscription |
| Prometheus + Grafana | Yes | Alertmanager, flexible rules | Manual setup | Advanced users | Free (self-hosted) |
| AppDynamics | Yes | AI-driven, KPI-linked alerts | Agent-based | Complex environments | $60/CPU core |
| Elastic APM | Yes | Kibana-based, ML detection | Modular | Developers, open-source | Free (self-hosted) |
| Nagios XI | Yes | Customizable, escalation policies | Plugin-based | Enterprise monitoring | $1,995 perpetual license |
| Zabbix | Yes | Flexible, multi-channel | Lightweight agents | Scalable deployments | Free (self-hosted) |
| ManageEngine AM | Yes | Real-time, proactive alerts | API-based | Hybrid environments | Annual subscription |
These tools help monitor infrastructure, reduce downtime, and improve user experience. Choose one based on your specific needs, budget, and technical expertise.
Performance monitoring for KVM guests – Avi Kivity, Red Hat, KVM Forum 2011
What to Look for in an APM Tool for KVM VPS
When selecting an APM tool for your KVM VPS, it’s crucial to focus on features that provide real-time insights and help prevent downtime. Here are the key aspects to consider:
Real-Time Performance Monitoring is essential for keeping tabs on CPU usage, memory, disk I/O, and network traffic. As Dynatrace explains:
Application performance monitoring is the practice of tracking key software application performance metrics using monitoring software and telemetry data. Practitioners use APM to ensure system availability, optimize service performance and response times, and improve user experiences.
Root Access Compatibility is a must when working with KVM VPS hosting. Platforms like VPS.us offer full root access, allowing you to install custom kernels and set up monitoring agents. An APM tool that leverages root-level agents will give you deeper insights into your system’s performance.
Comprehensive Error Tracking and Diagnostics are invaluable for troubleshooting. With features like detailed error logs, stack traces, and transaction flows, you can pinpoint not just that a problem occurred, but also where and why it happened.
Application Dependency Mapping helps you understand how different components interact, making it easier to anticipate and address cascading failures.
Scalability and Resource Efficiency are critical in VPS environments where resources are limited. Choose an APM tool that can grow with your needs without straining your VPS resources.
Customizable Alerting Systems ensure you’re notified about real issues without being overwhelmed by unnecessary alerts. Effective tools allow you to set thresholds tailored to your application’s needs and provide detailed information for swift resolution.
Integration Capabilities should enable seamless connections with your existing DevOps tools, ensuring a smooth workflow.
Multi-Environment Support is important for unified monitoring, especially if your infrastructure spans multiple global data centers. The tool should account for regional performance differences while providing a centralized view.
Historical Data and Trend Analysis allow you to establish performance baselines and detect anomalies. This data helps you identify and address potential bottlenecks before they affect users.
Finally, make sure the APM tool supports your Linux distributions, programming languages, and frameworks. Don’t forget to evaluate the total cost of ownership, including agent overhead and data retention, as a well-chosen APM tool can save you from costly outages in the long run.
1. New Relic

New Relic stands out as a top-tier option for monitoring KVM VPS environments. By combining metrics, events, logs, and traces (MELT), it offers a clear and comprehensive view of your application’s performance. This makes it especially useful for businesses managing complex applications on VPS infrastructure.
Real-time Monitoring Capabilities
New Relic employs lightweight agents installed on your VPS to deliver real-time monitoring. These agents collect performance data directly at the code level, sending it securely via HTTPS. Data is gathered every five seconds, offering near-instant insights, and the collection rate automatically adjusts based on system activity. This approach ensures a constant flow of actionable information, which pairs seamlessly with resource tracking to provide a full picture of your system’s performance.
Resource Usage Tracking (CPU, RAM, Disk, Network)
The “Hosts” dashboard is your go-to resource for tracking metrics like CPU usage, memory consumption, disk activity, and network traffic across your KVM VPS instances. It even includes detailed data on inbound and outbound network traffic, dropped packets, and disk usage trends.
New Relic shines in VPS setups by offering health metrics across multiple levels. From high-level stats like CPU load and memory usage to granular details on individual processes, network performance, and storage, you’re covered. Plus, the ability to filter data using tags, metadata, or custom attributes means you can focus on what matters most without sifting through irrelevant information.
What’s more, New Relic links application-level metrics – like error rates, response times, and throughput – with host-level data and configuration changes. This helps pinpoint whether a performance issue originates in your application code or from infrastructure limitations.
Alerting and Notification Systems
New Relic’s alerting system builds on its robust data collection to provide precise and actionable notifications. You can set custom alert thresholds tailored to your specific needs, ensuring you’re only notified about genuine issues. This minimizes false alarms and keeps your team focused.
The platform also integrates with popular communication tools and allows for issue escalation based on severity. Different notification channels can be configured, ensuring that the right team members are alerted about the right problems at the right time.
Seamless Integration with KVM VPS Environments
New Relic simplifies integration with KVM VPS environments through its guided installation process, which automatically detects your setup. For those who prefer manual configuration, the platform provides clear and detailed documentation. Installing the infrastructure agent involves straightforward steps, like copying and modifying configuration files.
To keep things running smoothly, it’s important to update both the integration package and the infrastructure agent regularly. If data collection takes longer than expected, you can tweak the timeout parameter in the configuration file to suit your environment’s needs. This streamlined process ensures minimal disruption, making it a great fit for KVM VPS setups.
Additionally, New Relic supports open-source telemetry frameworks like Prometheus and StatsD. This allows for easy integration into existing monitoring workflows without requiring a complete overhaul of your current system.
2. Datadog
Building on the approach of comprehensive monitoring seen with New Relic, Datadog also provides powerful insights tailored for KVM VPS environments. As a major player in the APM space, Datadog processes nearly a trillion metrics daily, offering full-stack monitoring for infrastructure, applications, and network performance within KVM VPS setups.
Real-time Monitoring Capabilities
Datadog’s strength lies in its Go-based agent, which continuously collects data from your KVM VPS infrastructure. It focuses on three key areas – Infrastructure Monitoring, Application Performance Monitoring (APM), and Network Monitoring – giving you visibility into every layer of your VPS environment.
Metrics are categorized into work, resource, and event types, making it easier to identify performance anomalies in real time. What truly sets Datadog apart is its smart alerting system, which includes outlier detection. Instead of sticking to rigid thresholds, it identifies unusual patterns in your VPS performance, helping you catch potential issues before they escalate. These features extend seamlessly into detailed resource usage monitoring.
Resource Usage Tracking (CPU, RAM, Disk, Network)
Datadog’s Process Check feature provides an in-depth look at individual processes, tracking CPU usage, memory consumption, threads, and I/O operations. This level of detail is particularly helpful when managing multiple applications on a single VPS or troubleshooting performance bottlenecks.
Beyond basic metrics, Datadog also tracks network performance, disk I/O activity, and memory allocation trends. This broad perspective helps you determine whether a problem is caused by resource limitations or application-level issues, giving you the insights needed to address the root cause effectively.
Alerting and Notification Systems
Datadog’s alerting system goes beyond simple notifications by correlating data from multiple layers to deliver detailed, context-rich alerts. You can set up notifications for processes that exceed specific thresholds, ensuring you’re aware of potential resource exhaustion before it impacts your applications.
When an alert is triggered, it includes related metrics to help you quickly identify the root cause rather than just the symptoms. This approach cuts down on investigation time and reduces the chances of false alarms, allowing you to focus on resolving critical issues.
Seamless Integration with KVM VPS Environments
Installing the lightweight Datadog agent on your KVM VPS is straightforward, and with pre-built integrations, you can start monitoring key applications and infrastructure immediately. With support for over 750 technologies, Datadog likely already covers the tools and applications you’re using.
The agent collects metrics, logs, and traces with minimal impact on system performance, making it a great fit for resource-sensitive VPS environments. For KVM VPS setups, it’s a good idea to begin with critical applications and infrastructure components, then gradually expand your monitoring coverage. This ensures you get immediate insights while scaling up your system monitoring over time.
3. Dynatrace

Dynatrace employs AI to automatically identify application issues and pinpoint their root causes across virtualization and application layers. It adapts in real-time to changes in infrastructure, making it especially effective for managing KVM VPS environments. One of its standout features is its ability to learn typical behavior patterns, ensuring that alerts are triggered only for genuine anomalies.
Real-time Monitoring Capabilities
What makes Dynatrace particularly powerful is its ability to learn baseline performance metrics, such as normal response times, error rates, and behavior patterns under load. Instead of relying on rigid, static thresholds, the platform dynamically adjusts to your specific KVM VPS setup. This means alerts are only triggered when performance deviates from what’s normal for your environment.
Another key feature is its auto-detection capability, which monitors new virtual machines as soon as they’re added – no manual setup required. This is a game-changer for businesses that frequently scale their VPS infrastructure, as it eliminates the overhead of reconfiguring monitoring systems for every new instance.
Dynatrace also provides a complete view of your virtualized infrastructure, showing how vCenters, processes, and applications are interconnected. This holistic perspective helps identify how issues in one area might ripple through the rest of your KVM VPS environment, offering deeper insights into performance dependencies.
Resource Usage Tracking (CPU, RAM, Disk, Network)
The platform excels at tracking critical resource usage at both the system and process levels. Within minutes of deployment, it delivers detailed metrics for CPU, memory, disk, and network performance.
- CPU and System Load: Tracks usage and overall system load to ensure optimal performance.
- Memory Metrics: Monitors page faults, swap usage, and other key indicators, which are crucial in KVM environments where guest memory allocation often exceeds physical memory.
- Disk Performance: Measures throughput and latency to detect bottlenecks.
- Network Monitoring: Analyzes traffic rates and connection quality to ensure stable communication.
This granular level of monitoring is particularly valuable for understanding resource allocation in virtualized environments, helping to identify inefficiencies and optimize memory provisioning.
Alerting and Notification Systems
Dynatrace’s alerting system goes beyond standard notifications by using its AI engine to correlate resource utilization data with other performance metrics. Instead of bombarding you with alerts for every minor issue, it provides context-rich notifications that identify the root cause of problems. This approach significantly reduces false positives and minimizes alert fatigue.
By learning your application’s typical behavior, Dynatrace ensures that you’re only notified about anomalies that genuinely require your attention, making it easier to focus on resolving critical issues.
Ease of Integration with KVM VPS Environments
Dynatrace integrates smoothly with KVM VPS setups, automatically adjusting to infrastructure changes without requiring extensive manual configuration. Its setup process is designed to optimize resource distribution across virtual machines, ensuring efficient performance monitoring from the start.
Once deployed, the platform offers insights into virtualization-specific operations that can impact performance, enabling seamless scaling of your infrastructure with robust monitoring in place – all without the need for additional configuration. This makes Dynatrace an excellent choice for dynamic, growing environments.
4. SolarWinds Server & Application Monitor
SolarWinds Server & Application Monitor (SAM) is a powerful tool designed to monitor over 1,200 vendor applications in KVM VPS hosting environments. It offers both agentless monitoring and detailed insights into server and application performance across Windows and Linux systems, all through an intuitive, template-driven platform.
Real-Time Monitoring Capabilities
At the heart of SAM is its Real-Time Process Explorer (RTPE), which provides instant access to all running processes from a centralized console. Without needing to log in to individual machines, administrators can view key metrics like physical memory, virtual memory, CPU usage, and disk I/O performance. SAM comes with hundreds of pre-built templates that display both real-time and historical data, all of which can be customized to meet specific monitoring needs. Its web console also includes tools for basic server management, while proactive performance tracking monitors uptime, downtime, and capacity to help prevent outages before they occur.
Resource Usage Tracking (CPU, RAM, Disk, Network)
With its Real-Time Process Explorer, SAM effectively tracks resource usage such as CPU, memory, disk I/O, and network traffic within virtualized environments. The platform also monitors storage volumes and disk usage, helping administrators identify potential capacity issues and bottlenecks. For network performance, SAM keeps an eye on traffic and packet levels to ensure smooth data flow between KVM VPS instances and external services. SolarWinds Observability SaaS enhances these capabilities by visualizing resource usage with color-coded data and time-series metrics, making it easier to spot trends and anomalies.
Alerting and Notification Systems
SAM’s alerting system is both customizable and intelligent. Administrators can define thresholds for various metrics, triggering automatic notifications when issues arise. These alerts are context-rich, correlating data from multiple sources to pinpoint root causes quickly. This targeted approach reduces unnecessary alerts, helping teams focus on resolving critical problems faster.
Seamless Integration with KVM VPS Environments
Integrating SAM into KVM VPS environments is straightforward, thanks to its automatic discovery feature that identifies servers and applications for monitoring. It supports a wide range of monitoring needs, including applications, hardware health, asset inventory, and overall performance. SAM also integrates seamlessly with other Orion Platform products, enabling unified monitoring across web performance, storage, networks, databases, and virtualized environments. This makes it a great choice for VPS.us clients seeking centralized monitoring for their global operations.
SAM’s agentless approach works effortlessly with both on-premises and cloud-based KVM VPS instances, whether hosted in data centers, remote sites, or cloud environments. It can monitor and alert on metrics from Microsoft applications, hypervisors, and major cloud services, making it ideal for hybrid hosting setups. The setup process includes configuring features like AppInsight for IIS, operating system monitoring, hardware health tracking, and cloud infrastructure monitoring. It also allows for global and local threshold settings, enabling automated monitoring and custom reporting tailored to KVM VPS hosting needs. This ease of integration and adaptability positions SAM as a strong contender among top application performance monitoring tools.
5. Prometheus with Grafana
For KVM VPS environments, having a solid real-time monitoring solution is essential. Prometheus and Grafana together form a powerful open-source duo that delivers both robust data collection and top-notch visualization. This combination is a cost-effective and flexible option for businesses of all sizes, making it a standout choice for KVM VPS hosting.
Real-Time Monitoring Capabilities
Prometheus is designed to collect time-series data using a pull-based approach. It regularly retrieves metrics directly from configured endpoints in your KVM VPS systems, ensuring reliable and consistent data collection. Unlike push-based methods, this approach minimizes data gaps and keeps your monitoring on track.
To gather data from services Prometheus can’t monitor directly, exporters like Node Exporter come into play. Node Exporter is particularly useful in KVM VPS setups, as it collects essential system metrics such as CPU usage, memory consumption, disk I/O, and network bandwidth. These metrics are then visualized in Grafana’s customizable dashboards, offering administrators a clear, real-time view of their systems.
Grafana adds another layer of flexibility by connecting to multiple data sources, not just Prometheus. This means you can integrate other monitoring tools and display all critical metrics in one centralized dashboard. This comprehensive setup simplifies resource tracking and helps administrators stay proactive with alerts.
Resource Usage Tracking (CPU, RAM, Disk, Network)
The Prometheus-Grafana combination is exceptional at monitoring resource usage in KVM VPS environments. It captures detailed data on CPU usage, RAM consumption, disk space, and network bandwidth, giving administrators a full picture of system performance.
This setup allows you to spot resource bottlenecks before they escalate into bigger problems. Grafana’s templating features make it easy to create dynamic dashboards that switch between servers or time periods. For businesses using VPS.us’s global KVM VPS infrastructure, this makes comparing resource usage across multiple instances seamless and efficient.
Alerting and Notification Systems
Beyond data collection, Prometheus and Grafana shine with their alerting capabilities. Prometheus includes an Alert Manager that sends notifications when metrics hit predefined thresholds. This ensures that administrators are immediately aware of any issues affecting their KVM VPS systems.
Grafana complements this with its own alerting system, which supports multiple notification channels like email, Slack, PagerDuty, and webhooks. You can customize alerts by severity level and escalation paths, tailoring the system to meet even the most complex operational needs.
Simple Integration with KVM VPS Environments
Setting up Prometheus and Grafana in a KVM VPS environment is refreshingly straightforward. Prometheus can be deployed using Docker images, which makes the process quick and hassle-free compared to more traditional monitoring tools that require complex configurations.
For VPS.us users, the integration process involves installing Prometheus and any necessary exporters, setting up Grafana, and configuring Prometheus as a data source. From there, you can create custom dashboards to visualize key metrics and establish alerts for critical performance indicators.
This monitoring solution is particularly well-suited for VPS.us’s KVM VPS infrastructure, whether you’re working across their 17 global data centers or in hybrid cloud setups. Its ability to handle large-scale systems makes it an excellent choice for businesses managing multiple VPS instances across different regions, all while maintaining centralized control and visibility.
6. AppDynamics
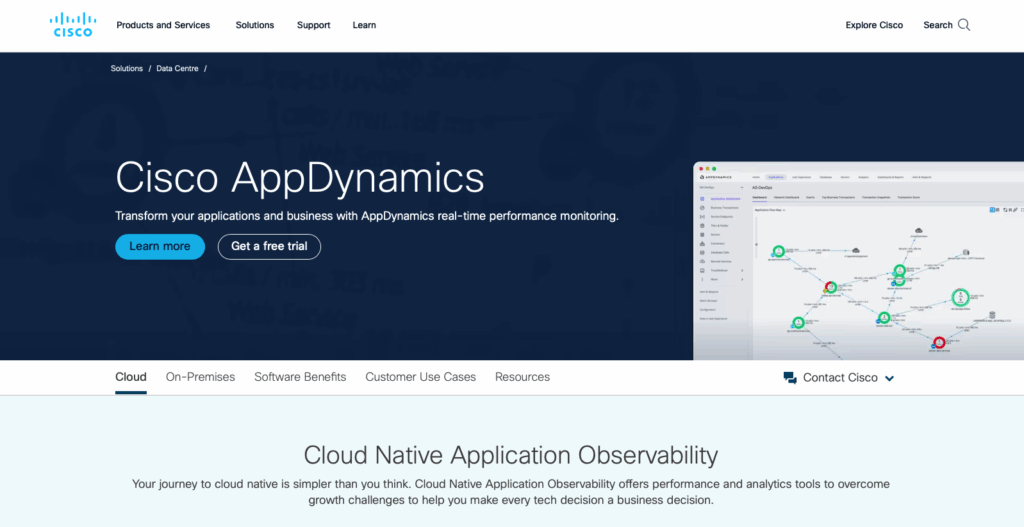
AppDynamics is a robust application performance monitoring (APM) tool tailored for KVM VPS environments. It’s especially useful for managing complex deployments.
Real-Time Monitoring Capabilities
With AppDynamics, you can monitor business transactions in real time using agents powered by OpenTelemetry. These agents automatically map application flows and capture performance details down to the method call level. The platform’s AI-based anomaly detection identifies issues before they disrupt your services.
It also automatically detects common application frameworks and services running on your VPS instances, collecting essential data to create flow maps. These visual diagrams help you understand how data moves through your application components, making it easier to navigate complex system interactions across VPS.us’s global infrastructure.
Beyond basic monitoring, AppDynamics delivers end-to-end visibility. Its integration with Cisco ThousandEyes adds network monitoring, helping you see how network services impact user experiences across various regions. This comprehensive approach extends to detailed resource tracking, ensuring no aspect of performance is overlooked.
Resource Usage Tracking (CPU, RAM, Disk, Network)
The AppDynamics Machine Agent is built to gather key hardware metrics, giving you a clear view of your server’s resources. It monitors CPU, memory, disk, and network usage across your KVM VPS instances, laying the groundwork for effective resource management.
| Metric Name | Description | Windows | Linux | Monitoring Mode |
|---|---|---|---|---|
| %Idle | Percentage of time the CPU was idle | ✓ | ✓ | Diagnostic |
| %Busy | Percentage of time the CPU was processing | ✓ | ✓ | KPI |
| Total (MB) | Total memory available | ✓ | ✓ | KPI |
| Used % | Percentage of memory in use | ✓ | ✓ | KPI |
| KB read/sec | Data read from all disks per second | ✓ | ✓ | Advanced |
| KB written/sec | Data written to all disks per second | ✓ | ✓ | Advanced |
| Incoming KB/sec | Data received by network devices per second | ✓ | ✓ | KPI |
| Outgoing KB/sec | Data sent by network devices per second | ✓ | ✓ | KPI |
Alerting and Notification Systems
AppDynamics works seamlessly with incident management tools to deliver real-time alerts for performance issues. Its AI-driven root-cause analysis helps you quickly resolve problems and maintain compliance with service-level agreements (SLAs).
With over 35 dashboards and 350 metrics for monitoring, the platform ensures administrators have access to critical performance data. These detailed alerts and insights make it easier to manage your KVM VPS infrastructure and address issues before they escalate.
Ease of Integration with KVM VPS Environments
AppDynamics simplifies integration with KVM VPS environments, making deployment straightforward across global infrastructures. Its cloud-based design means you don’t need to install the main platform on your server.
The integration process involves installing the AppDynamics package, generating an API client, and configuring the client name, client secret, endpoint, API key, and metric entities in the configuration file. The platform also offers a Kubernetes-based virtual appliance, which streamlines deployment and minimizes compatibility concerns.
For VPS.us customers, this means you can quickly roll out monitoring across your instances, whether you’re working in a single data center or managing applications across multiple global locations. AppDynamics excels in baselining application performance, end-user experiences, and infrastructure metrics, making it a valuable tool for cloud migrations and long-term performance improvements.
7. Elastic APM

Elastic APM stands out as a powerful tool for monitoring KVM VPS environments. Recognized as a 2024 Gartner® Magic Quadrant™ Leader, it combines instrumentation, analytics, and visualization into a unified platform.
Real-Time Monitoring Capabilities
Elastic APM provides detailed real-time monitoring for applications running on KVM VPS infrastructure. It collects data on key performance indicators like request response times, database queries, cache calls, and external HTTP requests, offering a clear view of how applications perform across VPS.us’s global network.
The platform automatically captures unhandled errors and exceptions, grouping them by stack trace to help pinpoint recurring issues quickly. Beyond application-level metrics, Elastic APM also collects host-level and agent-specific data, providing a comprehensive view of application health.
Real User Monitoring (RUM) adds another layer of insight by capturing real-time user interactions, including load times and responsiveness. To use RUM, initialize the RUM Agent in your application and enable source mapping for error stack traces. This setup ensures full functionality and provides actionable insights into the end-user experience, enhancing resource tracking and alerting precision.
Resource Usage Tracking (CPU, RAM, Disk, Network)
Elastic APM tracks application-level metrics and works seamlessly with Metricbeat to deliver more detailed system metrics, such as CPU usage, memory consumption, disk I/O, and network activity.
“Different APM agents collect different metrics… the APM agent is not going to collect as detailed infrastructure metrics as metricbeat or the elastic agent which collect Up to literally hundreds of infrastructure metrics.” – stephenb, Elastic Team Member
Metricbeat’s system module gathers critical data, including per-core CPU usage, disk space, memory stats, network I/O, and per-process details. Together, Elastic APM and Metricbeat provide a complete picture of both application performance and system-level resource usage, all visualized through Kibana dashboards.
Alerting and Notification Systems
Elastic APM integrates tightly with Elasticsearch and Kibana to deliver advanced alerting capabilities. Alerts can be configured based on performance thresholds, error rates, or response times, combining application and infrastructure metrics for a holistic view of your KVM VPS environment.
With Kibana’s visualization tools, you can create custom dashboards to monitor real-time performance data alongside historical trends, making it easier to identify and address potential issues.
Ease of Integration with KVM VPS Environments
Elastic APM’s modular design – comprising APM Agents, APM Server, Elasticsearch, and Kibana – ensures seamless integration with KVM VPS deployments. APM Agents are installed directly into applications to automatically collect performance data.
For KVM VPS setups, you can configure APM Agents to send data to an APM Server, which can run on your VPS or another server based on your preferences. For RUM and mobile agent data, the Elastic Agent must run centrally, while backend services can use co-located agents on edge machines.
Elastic APM integrates smoothly into VPS.us’s KVM VPS environments, offering centralized configuration management through Fleet. This setup provides a unified control system for managing performance data across single or multi-location deployments. With Fleet, you can manage Elastic Agents with APM integration enabled, ensuring consistent performance monitoring across VPS.us’s global infrastructure.
8. Nagios XI
Nagios XI stands out among APM tools with its plugin-based approach to monitoring. Designed for administrators who need real-time, customizable monitoring and flexible alert management, it’s a robust solution for KVM VPS environments. Built on Nagios Core 4, this enterprise-level monitoring tool supports over 10,000 customers worldwide, offering both flexibility and scalability.
Real-Time Monitoring Capabilities
Nagios XI uses a combination of SNMP traps, passive checks every 30 seconds, and the Nagios Cross-Platform Agent (NCPA) to deliver real-time monitoring of KVM VPS environments. This layered approach ensures consistent performance tracking across different operating systems, significantly reducing response times compared to traditional monitoring methods.
Tracking Resource Usage (CPU, RAM, Disk, Network)
Nagios XI employs specialized plugins to monitor key resource metrics like CPU, RAM, disk, and network usage. For instance:
- Disk Space: Use commands like
check_disk!20%!10%!/to monitor disk usage. - CPU Load: Commands such as
check_load!5.0,4.0,3.0!10.0,6.0,4.0track CPU performance.
| Check Type | Description | Example Command |
|---|---|---|
| Disk Space | Monitors disk usage | check_disk!20%!10%!/ |
| CPU Load | Monitors CPU performance | check_load!5.0,4.0,3.0!10.0,6.0,4.0 |
The NCPA agent, installed on each virtual server, collects data that Nagios Core processes. Based on predefined thresholds, statuses like OK, Warning, or Critical are assigned, ensuring reliable resource monitoring across all KVM VPS instances.
Alerting and Notification Systems
Nagios XI provides detailed alert management with options for email, SMS, and escalation policies. You can define contacts and contact groups to route notifications based on issue type and severity.
- SMS Alerts: Configure your mail server to send emails to SMS gateways in the format
1234567890@carrier.com. - Escalation Policies: Automatically notify additional contacts or escalate to higher-level personnel if issues remain unresolved, reducing the risk of critical problems being overlooked.
Additionally, event handlers enable automated responses, such as restarting services or executing scripts when specific conditions are met. This automation minimizes downtime and reduces the need for manual interventions, especially during off-hours.
Seamless Integration with KVM VPS Environments
Nagios XI integrates effortlessly with VPS.us KVM VPS environments through its agent-based monitoring system. The setup involves deploying the NCPA agent on each instance to be monitored and configuring service checks on the central Nagios XI server.
The plugin-based architecture makes it easy to customize monitoring for both standard metrics and unique application performance indicators. The web interface simplifies configuration, allowing users to define hosts, services, and notification rules without needing to edit files manually. This balance of customization and ease of use ensures that Nagios XI meets the demands of enterprise environments while remaining accessible to teams with varying technical expertise.
9. Zabbix
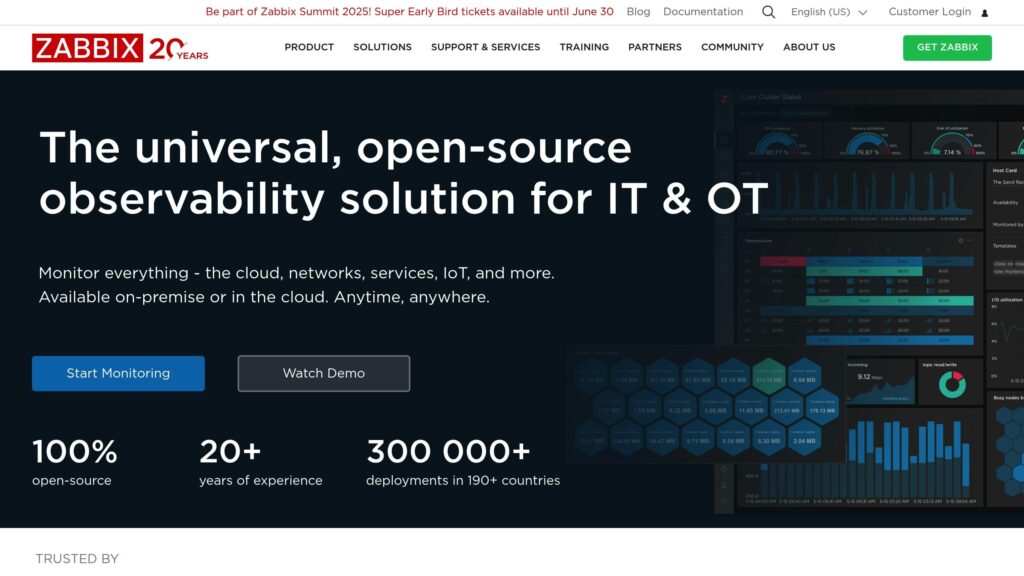
Zabbix is a powerful open-source monitoring platform tailored for KVM VPS environments. With its 99.98% uptime guarantee and a feature set designed to handle deployments of any scale, it’s a go-to solution for real-time monitoring, resource tracking, and seamless integration. Let’s break down what makes Zabbix a standout choice for KVM VPS.
Real-Time Monitoring Capabilities
Zabbix provides continuous, real-time insights into your entire KVM VPS infrastructure. It collects and processes performance data around the clock, ensuring you always have a clear picture of your system’s health.
To achieve this, Zabbix employs a mix of active and passive checks. Active checks involve the Zabbix server directly querying monitored hosts for data, while passive checks allow the Zabbix agent to send data without prompting. This dual approach ensures thorough coverage and reduces the risk of missing critical performance issues.
Tracking Resource Usage: CPU, RAM, Disk, and Network
Zabbix excels at monitoring key resources like CPU, RAM, disk I/O, and network traffic. Its detailed templates are designed to detect potential bottlenecks before they impact performance.
- CPU: Tracks real-time usage and alerts you when processors are nearing their limits.
- RAM: Goes beyond basic usage stats, offering insights into memory allocation to help avoid slowdowns caused by insufficient memory.
- Disk: Monitors both space utilization and I/O performance, identifying issues like high read/write speeds or long queue lengths that can degrade VPS performance.
- Network: Keeps an eye on bandwidth usage, inbound/outbound traffic, and packet loss to ensure smooth communication with clients.
| Resource Type | Monitoring Focus | Key Metrics |
|---|---|---|
| CPU | Real-time usage | Load average, utilization, process count |
| RAM | Allocation patterns | Used/free memory, swap usage, buffer/cache utilization |
| Disk | I/O performance and space | Read/write speeds, disk space, queue length |
| Network | Bandwidth and traffic | Inbound/outbound traffic, packet loss, connection count |
Alerts and Notifications
Zabbix’s alerting system is highly flexible, ensuring you’re notified the moment something needs attention. Alerts can be sent via email, SMS, or webhooks, and you can set up custom triggers and escalation policies to suit your needs.
Seamless Integration with KVM VPS
Zabbix integrates smoothly with KVM VPS environments, including VPS.us. Lightweight agents and prebuilt templates make setup straightforward, while features like automatic discovery and low-level rules simplify scaling. Whether you’re managing on-premises servers or cloud instances, Zabbix provides a unified monitoring experience that keeps everything under control.
10. ManageEngine Applications Manager

ManageEngine Applications Manager wraps up our list as a powerful enterprise monitoring tool designed to handle KVM VPS environments effectively. It’s particularly known for its seamless integration with virtualization setups and its ability to monitor both host servers and virtual machines in-depth.
Real-Time Monitoring Features
Applications Manager connects directly to KVM host servers using standard APIs and Linux CLI commands, creating a direct link between your monitoring dashboard and your virtual infrastructure. This setup ensures you get real-time updates on the health and performance of both host servers and their VMs.
The platform’s proactive monitoring continuously gathers performance data, offering a clear and detailed view of your KVM environment. Whether you manage a single VPS or a cluster of virtual machines on multiple hosts, the tool ensures uninterrupted visibility into your infrastructure. This real-time data forms the foundation for precise resource tracking.
Detailed Resource Monitoring (CPU, Memory, Disk, Network)
Applications Manager provides comprehensive insights into key resources such as CPU, memory, disk, and network usage:
- CPU Monitoring: Tracks utilization, user time, and system time for each VM and host core, helping identify overburdened cores for better resource management.
- Memory Monitoring: Offers data on usage, free space, and total allocation, allowing you to pinpoint potential memory constraints before they affect performance.
- Disk Monitoring: Keeps tabs on capacity, used and free space, as well as I/O operations like read/write activities and data transfer, giving a clear picture of storage performance.
- Network Monitoring: Monitors metrics like bytes and packets sent or received, helping you detect traffic bottlenecks or unusual activity.
| Resource Type | Key Metrics Tracked | Monitoring Coverage |
|---|---|---|
| CPU | Utilization %, user time, system time | Tracks individual core usage |
| Memory | Utilization %, used memory, free memory, total memory | Per-VM and host-level insights |
| Disk | Capacity, used/free space, read/write operations, bytes transferred | Tracks storage pools and volumes |
| Network | Bytes/packets sent and received | Highlights network performance metrics |
Alerts and Notifications
The alerting system in Applications Manager is designed to catch problems early. By keeping an eye on critical performance metrics, it sends notifications to IT teams whenever something deviates from normal parameters. This allows you to address issues quickly, often before they impact users or escalate into larger problems.
Seamless Integration with KVM VPS
Applications Manager is tailored for KVM VPS environments, offering smooth integration using a host name or IP address alongside root credentials. For full access to system metrics, the platform recommends using the root account.
One standout feature is its ability to automatically discover and monitor new virtual machines as they’re created or added. This eliminates the hassle of manually configuring each new VM, saving time and effort.
For VPS.us users, this seamless integration means you can deploy a robust monitoring system across your KVM VPS instances with minimal setup. Thanks to its reliance on standard APIs and Linux CLI commands, the platform ensures compatibility with VPS.us’s infrastructure, delivering performance insights from the moment it’s configured.
How to Set Up APM Tools with VPS.us KVM VPS
Getting APM tools up and running on your VPS.us KVM VPS involves preparing your server and configuring the right agent for your application. Here’s how to do it step by step.
Initial VPS Preparation
Start by connecting to your server via SSH using your VPS.us root credentials. Once logged in, update your system packages to ensure everything is up-to-date.
For better security, create a non-root user specifically for handling APM tasks. This helps keep your root account safe while allowing the new user to manage monitoring operations. Next, configure basic network settings and, if your monitoring workload is memory-intensive, set up swap space to provide additional memory buffering.
Install essential development tools, such as Git and build utilities. Many APM agents require these for dependency management or compilation. With these steps completed, your server is ready for the next phase: installing the APM agent.
Agent Installation Process
For Java Applications:
Set the necessary environment variables like apminsight.apm.host, apminsight.application.name, apminsight.license.key, and apminsight.agent.server.port. These variables configure the agent to communicate with your monitoring server, identify your application, and authenticate with your APM tool. Once configured, restart your Java application to activate the agent. The agent will immediately begin collecting performance data and sending it to your APM dashboard.
For Python, Node.js, or PHP:
Use the appropriate package manager or download the agent directly. Install the agent package, set up the application key, and modify your startup scripts to include the monitoring library. This ensures the agent integrates seamlessly with your application from the moment it starts.
Network and Security Configuration
Ensure your firewall allows outbound HTTPS traffic on port 443, which is essential for communication between the agent and the monitoring server. If your APM tool requires secure data transmission, set up SSL certificates to encrypt the communication between agents and collectors. This step is especially important for enterprise-level monitoring solutions that prioritize data security.
Resource Optimization for APM
To maximize performance, enable virtio drivers on your VPS, which improve input/output operations. For network-heavy monitoring tasks, configure multi-queue virtio-net. This feature allows your server to handle multiple network queues simultaneously, reducing latency during high data transmission.
Additionally, install the TuneD utility and activate the virtual-guest profile. This tool helps optimize resource allocation by fine-tuning CPU scheduling, memory usage, and I/O priorities for virtualized environments.
Database and Storage Setup
If your APM tool requires a database, install and configure MySQL, PostgreSQL, or MongoDB based on your needs. Fine-tune the database settings to improve performance and handle frequent read/write operations efficiently.
For storage, take advantage of VPS.us’s NVMe drives, which offer excellent speed. Optimize these drives to handle the demands of APM tools, such as frequent logging. Implement log rotation and set retention policies to balance storage use with your need for historical data.
Monitoring Stack Integration
To get a complete view of your server’s performance, integrate your APM tool with other monitoring systems. A popular combination is Prometheus and Grafana. Install Prometheus as your metrics collector and configure exporters for system metrics. Then, use Grafana to visualize the data. This setup works particularly well on VPS.us KVM VPS servers, which provide consistent performance for monitoring tasks.
When configuring data retention policies, consider your VPS plan’s storage limits. For example, the KVM1-US plan with 20 GB storage may require stricter retention settings than the KVM8-US plan, which offers 80 GB.
Performance Tuning and Validation
Once your APM tools are installed, validate the setup by generating test traffic and checking that performance data appears on your dashboard. Ensure all configured metrics are being collected and transmitted accurately.
Keep an eye on the resource usage of your APM tools. If they create noticeable overhead, adjust data collection intervals or reduce the granularity of metrics. Set alert thresholds based on your server’s capacity and monitoring needs.
Finally, test failover scenarios like temporary network disconnections to ensure your APM agents can recover smoothly. VPS.us’s reliable infrastructure helps maintain continuity even during maintenance, ensuring your monitoring setup stays operational.
Feature Comparison Table
When choosing an APM tool for KVM VPS hosting, it’s important to evaluate the key features that directly impact your VPS deployments. Here’s a comparison of some popular options:
| APM Tool | Real-Time Monitoring | Alerting System | Historical Analytics | Integration Ease | KVM VPS Suitability | Starting Price |
|---|---|---|---|---|---|---|
| New Relic | Full-stack observability with NRQL analytics | Custom thresholds with multi-channel alerts | 100 GB/month data retention | Auto-discovery with extensive integrations | Excellent for smaller setups – free tier available | Free tier available |
| Datadog | Unified metrics, traces, and logs | Customizable alert thresholds | Advanced analytics with broad integration support | One-click setup for most services | Comprehensive platform – ideal for larger deployments | $31/host/month |
| Dynatrace | OneAgent auto-instrumentation | Davis AI for proactive alerts | AI-driven root cause analysis | Automated service discovery | Enterprise-focused – suitable for large-scale environments | Custom pricing |
| Prometheus + Grafana | PromQL-based metric collection | Alertmanager with flexible routing | Long-term storage with retention policies | Manual configuration required | Highly customizable – great for advanced users | Free (self-hosted) |
| AppDynamics | Business transaction monitoring | Business iQ linking performance to KPIs | Deep dive analytics with code-level visibility | Agent-based deployment | Best for complex environments | $60/CPU core |
| Elastic APM | Seamless Elastic Stack integration | Kibana-based alerting with ML anomaly detection | Full-text search across performance data | Simple agent installation | Open-source flexibility – ideal for developers | Free (self-hosted) |
| ManageEngine AM | Application and infrastructure monitoring | Real-time alerting system | Performance analytics with forecasting | Simplified application management | User-friendly interface – good for smaller setups | Annual subscription pricing |
The table provides an overview of the core features, but let’s dive deeper into what matters most for KVM VPS users.
Key Considerations for KVM VPS Users
When selecting an APM tool for your VPS environment, there are several important factors to keep in mind:
- Resource Overhead: Tools differ in how they impact system resources. Commercial solutions tend to be optimized for minimal resource usage, while open-source options like Prometheus may require manual adjustments to avoid burdening your VPS.
- Pricing Models: Cost structures vary widely. For instance, Datadog’s usage-based pricing might lead to unexpected costs during traffic spikes, whereas New Relic’s free tier is perfect for smaller deployments. Open-source tools like Prometheus and Elastic APM eliminate licensing fees but demand more operational expertise.
- Setup Complexity: Ease of setup is another key factor. Dynatrace simplifies deployment with its OneAgent auto-configuration, while Prometheus offers more flexibility but requires manual setup, making it better suited for advanced users.
- Alerting Capabilities: Automated alerting can save time and reduce manual oversight. Dynatrace’s Davis AI pinpoints root causes automatically, while Prometheus relies on user-defined alert rules for customization.
- Data Retention: Storage needs vary by tool. Some, like New Relic, offer generous free tiers, while others use a pay-as-you-go model. Self-hosted tools like Elastic APM allow you to adjust retention settings based on your available storage.
Ultimately, for VPS.us KVM VPS users, the best APM tool depends on your specific needs. Balancing feature depth with resource efficiency is key to ensuring your monitoring solution aligns with your deployment size and operational goals.
Conclusion
APM tools play a key role in keeping systems running smoothly, improving performance, and enhancing security. They help maintain uptime by proactively monitoring systems to prevent crashes or downtime. When it comes to performance, these tools identify issues in areas like CPU, memory, disk I/O, and network traffic, enabling administrators to fine-tune configurations for better efficiency. On the security front, they monitor unusual patterns in network traffic and resource usage, helping to detect and address potential breaches. All of these benefits directly impact business success.
In fact, a 2022 Portent study highlights that faster load times can directly increase conversion rates – a clear example of how performance improvements pay off.
The infrastructure at VPS.us is perfectly suited for deploying APM tools. With full root access on every KVM VPS, users can customize monitoring configurations to their specific needs. The strong isolation between VPS instances ensures that monitoring data remains accurate, free from interference caused by neighboring accounts. Plus, enterprise-grade hardware provides the power needed to handle both applications and monitoring tools without compromise.
With 17 global data center locations, businesses can position their monitoring systems close to their audience, reducing latency and improving performance metrics. This global reach ensures that monitoring data is timely and actionable, no matter the region. Additionally, VPS.us offers built-in resource usage metrics and VPS status logs that integrate effortlessly with third-party APM tools, creating a seamless monitoring experience.
Whether you opt for commercial solutions like New Relic or open-source options like Prometheus paired with Grafana, VPS.us’s robust KVM infrastructure ensures your applications stay optimized and running at their best.


